Immigrants from Peru vs Immigrants from Kuwait In Labor Force | Age 25-29
COMPARE
Immigrants from Peru
Immigrants from Kuwait
In Labor Force | Age 25-29
In Labor Force | Age 25-29 Comparison
Immigrants from Peru
Immigrants from Kuwait
84.7%
IN LABOR FORCE | AGE 25-29
58.6/ 100
METRIC RATING
160th/ 347
METRIC RANK
84.6%
IN LABOR FORCE | AGE 25-29
38.2/ 100
METRIC RATING
184th/ 347
METRIC RANK
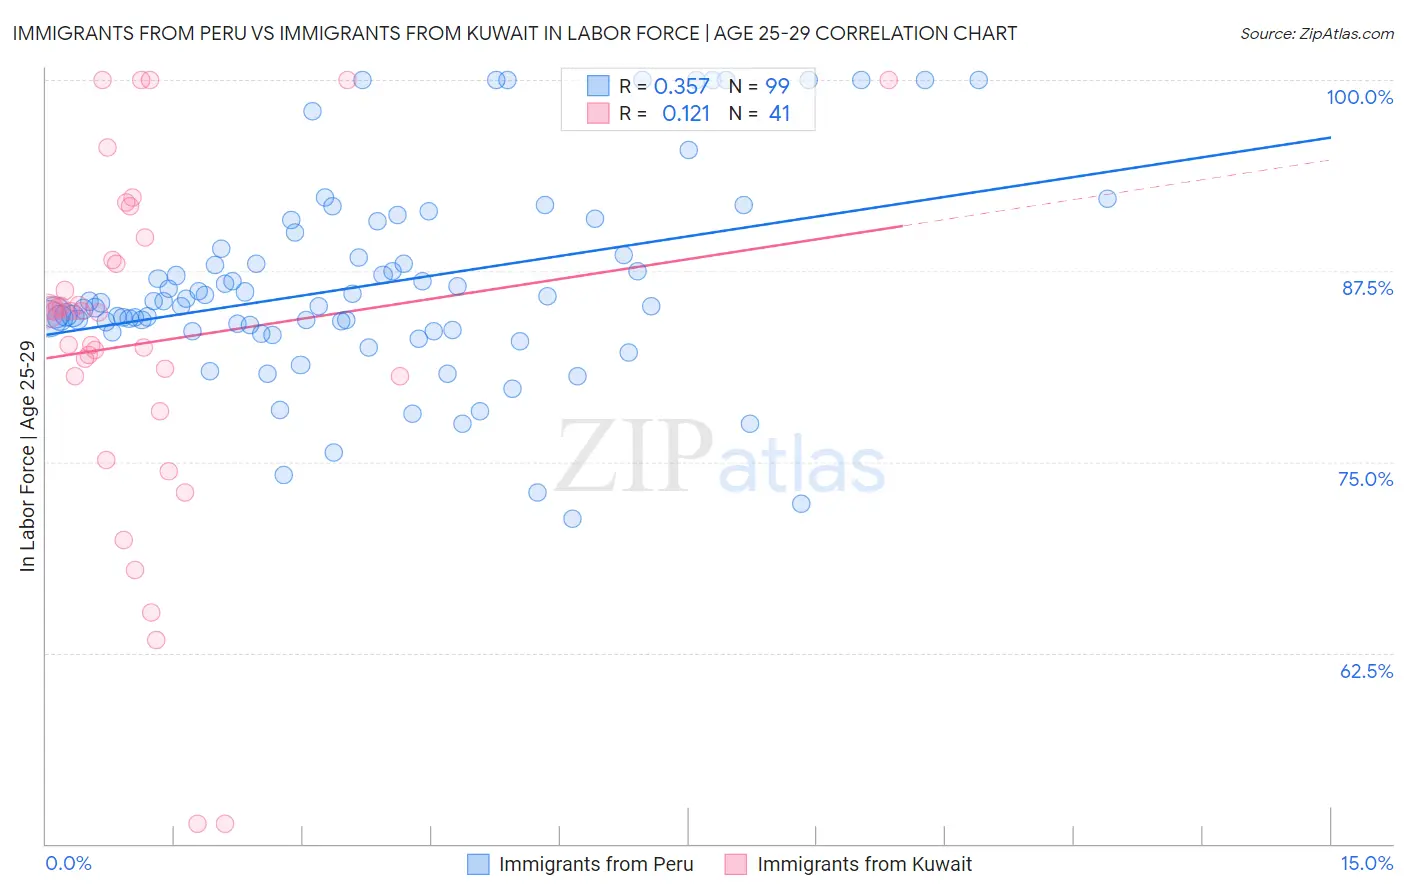
Immigrants from Peru vs Immigrants from Kuwait In Labor Force | Age 25-29 Correlation Chart
The statistical analysis conducted on geographies consisting of 328,804,667 people shows a mild positive correlation between the proportion of Immigrants from Peru and labor force participation rate among population between the ages 25 and 29 in the United States with a correlation coefficient (R) of 0.357 and weighted average of 84.7%. Similarly, the statistical analysis conducted on geographies consisting of 136,915,125 people shows a poor positive correlation between the proportion of Immigrants from Kuwait and labor force participation rate among population between the ages 25 and 29 in the United States with a correlation coefficient (R) of 0.121 and weighted average of 84.6%, a difference of 0.15%.
In Labor Force | Age 25-29 Correlation Summary
| Measurement | Immigrants from Peru | Immigrants from Kuwait |
| Minimum | 71.3% | 51.3% |
| Maximum | 100.0% | 100.0% |
| Range | 28.7% | 48.7% |
| Mean | 86.6% | 82.8% |
| Median | 85.4% | 84.8% |
| Interquartile 25% (IQ1) | 83.5% | 79.5% |
| Interquartile 75% (IQ3) | 88.9% | 89.0% |
| Interquartile Range (IQR) | 5.4% | 9.5% |
| Standard Deviation (Sample) | 6.5% | 11.6% |
| Standard Deviation (Population) | 6.5% | 11.5% |
Similar Demographics by In Labor Force | Age 25-29
Demographics Similar to Immigrants from Peru by In Labor Force | Age 25-29
In terms of in labor force | age 25-29, the demographic groups most similar to Immigrants from Peru are Canadian (84.7%, a difference of 0.0%), Immigrants from Colombia (84.7%, a difference of 0.0%), British (84.7%, a difference of 0.010%), Immigrants from Ghana (84.7%, a difference of 0.010%), and Immigrants from Western Africa (84.7%, a difference of 0.010%).
| Demographics | Rating | Rank | In Labor Force | Age 25-29 |
| Immigrants | Taiwan | 62.2 /100 | #153 | Good 84.7% |
| Immigrants | Sri Lanka | 61.7 /100 | #154 | Good 84.7% |
| Indians (Asian) | 61.6 /100 | #155 | Good 84.7% |
| French | 61.0 /100 | #156 | Good 84.7% |
| British | 60.4 /100 | #157 | Good 84.7% |
| Immigrants | Ghana | 60.2 /100 | #158 | Good 84.7% |
| Immigrants | Western Africa | 60.1 /100 | #159 | Good 84.7% |
| Immigrants | Peru | 58.6 /100 | #160 | Average 84.7% |
| Canadians | 58.5 /100 | #161 | Average 84.7% |
| Immigrants | Colombia | 58.3 /100 | #162 | Average 84.7% |
| Argentineans | 57.9 /100 | #163 | Average 84.7% |
| Ghanaians | 57.6 /100 | #164 | Average 84.7% |
| Immigrants | Burma/Myanmar | 57.4 /100 | #165 | Average 84.7% |
| Immigrants | Spain | 56.9 /100 | #166 | Average 84.7% |
| Indonesians | 56.5 /100 | #167 | Average 84.7% |
Demographics Similar to Immigrants from Kuwait by In Labor Force | Age 25-29
In terms of in labor force | age 25-29, the demographic groups most similar to Immigrants from Kuwait are Scottish (84.6%, a difference of 0.010%), Immigrants from Denmark (84.6%, a difference of 0.010%), European (84.6%, a difference of 0.020%), Immigrants from Norway (84.6%, a difference of 0.030%), and Immigrants from Belgium (84.6%, a difference of 0.030%).
| Demographics | Rating | Rank | In Labor Force | Age 25-29 |
| Immigrants | China | 45.7 /100 | #177 | Average 84.6% |
| Immigrants | Thailand | 45.2 /100 | #178 | Average 84.6% |
| Immigrants | Argentina | 44.0 /100 | #179 | Average 84.6% |
| Immigrants | South America | 42.9 /100 | #180 | Average 84.6% |
| Immigrants | Norway | 41.9 /100 | #181 | Average 84.6% |
| Europeans | 40.3 /100 | #182 | Average 84.6% |
| Scottish | 40.1 /100 | #183 | Average 84.6% |
| Immigrants | Kuwait | 38.2 /100 | #184 | Fair 84.6% |
| Immigrants | Denmark | 37.0 /100 | #185 | Fair 84.6% |
| Immigrants | Belgium | 35.0 /100 | #186 | Fair 84.6% |
| Immigrants | Portugal | 34.7 /100 | #187 | Fair 84.6% |
| Immigrants | Ukraine | 33.7 /100 | #188 | Fair 84.5% |
| Moroccans | 32.6 /100 | #189 | Fair 84.5% |
| Welsh | 31.1 /100 | #190 | Fair 84.5% |
| Zimbabweans | 28.7 /100 | #191 | Fair 84.5% |