Immigrants from Panama vs Greek In Labor Force | Age 20-64

COMPARE

Immigrants from Panama
Race
Ancestry
AfghanAfricanAlaska NativeAlaskan AthabascanAlbanianAleutAlsatianAmericanApacheArabArapahoArgentineanArmenianAssyrian/Chaldean/SyriacAustralianAustrianBahamianBangladeshiBarbadianBasqueBelgianBelizeanBermudanBhutaneseBlackfeetBolivianBrazilianBritishBritish West IndianBulgarianBurmeseCajunCambodianCanadianCape VerdeanCarpatho RusynCelticCentral AmericanCentral American IndianCherokeeCheyenneChickasawChileanChineseChippewaChoctawColombianColvilleComancheCosta RicanCreeCreekCroatianCrowCubanCypriotCzechCzechoslovakianDanishDelawareDominicanDutchDutch West IndianEastern EuropeanEcuadorianEgyptianEnglishEstonianEthiopianEuropeanFijianFilipinoFinnishFrenchFrench American IndianFrench CanadianGermanGerman RussianGhanaianGuamanian/ChamorroGuatemalanGuyaneseHaitianHmongHonduranHopiHoumaHungarianIcelanderIndian (Asian)IndonesianInupiatIranianIraqiIrishIroquoisIsraeliItalianJamaicanJapaneseJordanianKenyanKiowaKoreanLaotianLatvianLebaneseLiberianLithuanianLumbeeLuxembourgerMacedonianMalaysianMalteseMarshalleseMenomineeMexicanMexican American IndianMongolianMoroccanNative HawaiianNavajoNepaleseNew ZealanderNicaraguanNigerianNorthern EuropeanNorwegianOkinawanOsageOttawaPaiutePakistaniPalestinianPanamanianParaguayanPennsylvania GermanPeruvianPimaPolishPortuguesePotawatomiPuebloPuerto RicanPuget Sound SalishRomanianRussianSalvadoranSamoanScandinavianScotch-IrishScottishSeminoleSenegaleseSerbianShoshoneSierra LeoneanSiouxSlavicSlovakSloveneSomaliSouth AfricanSouth AmericanSouth American IndianSoviet UnionSpaniardSpanishSpanish AmericanSpanish American IndianSri LankanSubsaharan AfricanSudaneseSwedishSwissSyrianTaiwaneseThaiTlingit-HaidaTohono O'OdhamTonganTrinidadian and TobagonianTsimshianTurkishU.S. Virgin IslanderUgandanUkrainianUruguayanUteVenezuelanVietnameseWelshWest IndianYakamaYaquiYugoslavianYumanYup'ikZimbabwean
Immigration
NonimmigrantsImmigrantsAfghanistanAfricaAlbaniaArgentinaArmeniaAsiaAustraliaAustriaBahamasBangladeshBarbadosBelarusBelgiumBelizeBoliviaBosnia and HerzegovinaBrazilBulgariaBurma/MyanmarCabo VerdeCambodiaCameroonCanadaCaribbeanCentral AmericaChileChinaColombiaCongoCosta RicaCroatiaCubaCzechoslovakiaDenmarkDominicaDominican RepublicEastern AfricaEastern AsiaEastern EuropeEcuadorEgyptEl SalvadorEnglandEritreaEthiopiaEuropeFijiFranceGermanyGhanaGreeceGrenadaGuatemalaGuyanaHaitiHondurasHong KongHungaryIndiaIndonesiaIranIraqIrelandIsraelItalyJamaicaJapanJordanKazakhstanKenyaKoreaKuwaitLaosLatin AmericaLatviaLebanonLiberiaLithuaniaMalaysiaMexicoMicronesiaMiddle AfricaMoldovaMoroccoNepalNetherlandsNicaraguaNigeriaNorth AmericaNorth MacedoniaNorthern AfricaNorthern EuropeNorwayOceaniaPakistanPanamaPeruPhilippinesPolandPortugalRomaniaRussiaSaudi ArabiaScotlandSenegalSerbiaSierra LeoneSingaporeSomaliaSouth AfricaSouth AmericaSouth Central AsiaSouth Eastern AsiaSouthern EuropeSpainSri LankaSt. Vincent and the GrenadinesSudanSwedenSwitzerlandSyriaTaiwanThailandTrinidad and TobagoTurkeyUgandaUkraineUruguayUzbekistanVenezuelaVietnamWest IndiesWestern AfricaWestern AsiaWestern EuropeYemenZaireZimbabweAzores
Greek
Race
Ancestry
AfghanAfricanAlaska NativeAlaskan AthabascanAlbanianAleutAlsatianAmericanApacheArabArapahoArgentineanArmenianAssyrian/Chaldean/SyriacAustralianAustrianBahamianBangladeshiBarbadianBasqueBelgianBelizeanBermudanBhutaneseBlackfeetBolivianBrazilianBritishBritish West IndianBulgarianBurmeseCajunCambodianCanadianCape VerdeanCarpatho RusynCelticCentral AmericanCentral American IndianCherokeeCheyenneChickasawChileanChineseChippewaChoctawColombianColvilleComancheCosta RicanCreeCreekCroatianCrowCubanCypriotCzechCzechoslovakianDanishDelawareDominicanDutchDutch West IndianEastern EuropeanEcuadorianEgyptianEnglishEstonianEthiopianEuropeanFijianFilipinoFinnishFrenchFrench American IndianFrench CanadianGermanGerman RussianGhanaianGreekGuamanian/ChamorroGuatemalanGuyaneseHaitianHmongHonduranHopiHoumaHungarianIcelanderIndian (Asian)IndonesianInupiatIranianIraqiIrishIroquoisIsraeliItalianJamaicanJapaneseJordanianKenyanKiowaKoreanLaotianLatvianLebaneseLiberianLithuanianLumbeeLuxembourgerMacedonianMalaysianMalteseMarshalleseMenomineeMexicanMexican American IndianMongolianMoroccanNative HawaiianNavajoNepaleseNew ZealanderNicaraguanNigerianNorthern EuropeanNorwegianOkinawanOsageOttawaPaiutePakistaniPalestinianPanamanianParaguayanPennsylvania GermanPeruvianPimaPolishPortuguesePotawatomiPuebloPuerto RicanPuget Sound SalishRomanianRussianSalvadoranSamoanScandinavianScotch-IrishScottishSeminoleSenegaleseSerbianShoshoneSierra LeoneanSiouxSlavicSlovakSloveneSomaliSouth AfricanSouth AmericanSouth American IndianSoviet UnionSpaniardSpanishSpanish AmericanSpanish American IndianSri LankanSubsaharan AfricanSudaneseSwedishSwissSyrianTaiwaneseThaiTlingit-HaidaTohono O'OdhamTonganTrinidadian and TobagonianTsimshianTurkishU.S. Virgin IslanderUgandanUkrainianUruguayanUteVenezuelanVietnameseWelshWest IndianYakamaYaquiYugoslavianYumanYup'ikZimbabwean
Immigration
NonimmigrantsImmigrantsAfghanistanAfricaAlbaniaArgentinaArmeniaAsiaAustraliaAustriaBahamasBangladeshBarbadosBelarusBelgiumBelizeBoliviaBosnia and HerzegovinaBrazilBulgariaBurma/MyanmarCabo VerdeCambodiaCameroonCanadaCaribbeanCentral AmericaChileChinaColombiaCongoCosta RicaCroatiaCubaCzechoslovakiaDenmarkDominicaDominican RepublicEastern AfricaEastern AsiaEastern EuropeEcuadorEgyptEl SalvadorEnglandEritreaEthiopiaEuropeFijiFranceGermanyGhanaGreeceGrenadaGuatemalaGuyanaHaitiHondurasHong KongHungaryIndiaIndonesiaIranIraqIrelandIsraelItalyJamaicaJapanJordanKazakhstanKenyaKoreaKuwaitLaosLatin AmericaLatviaLebanonLiberiaLithuaniaMalaysiaMexicoMicronesiaMiddle AfricaMoldovaMoroccoNepalNetherlandsNicaraguaNigeriaNorth AmericaNorth MacedoniaNorthern AfricaNorthern EuropeNorwayOceaniaPakistanPeruPhilippinesPolandPortugalRomaniaRussiaSaudi ArabiaScotlandSenegalSerbiaSierra LeoneSingaporeSomaliaSouth AfricaSouth AmericaSouth Central AsiaSouth Eastern AsiaSouthern EuropeSpainSri LankaSt. Vincent and the GrenadinesSudanSwedenSwitzerlandSyriaTaiwanThailandTrinidad and TobagoTurkeyUgandaUkraineUruguayUzbekistanVenezuelaVietnamWest IndiesWestern AfricaWestern AsiaWestern EuropeYemenZaireZimbabweAzores
In Labor Force | Age 20-64
Income
Poverty
Unemployment
Labor Participation
Family Structure
Vehicle Availability
Education Level
Disability

In Labor Force | Age 20-64 Comparison

Immigrants from Panama

Greeks

Tragic
Exceptional
79.1%
IN LABOR FORCE | AGE 20-64
6.9/ 100
METRIC RATING
222nd/ 347
METRIC RANK
80.0%
IN LABOR FORCE | AGE 20-64
94.8/ 100
METRIC RATING
106th/ 347
METRIC RANK

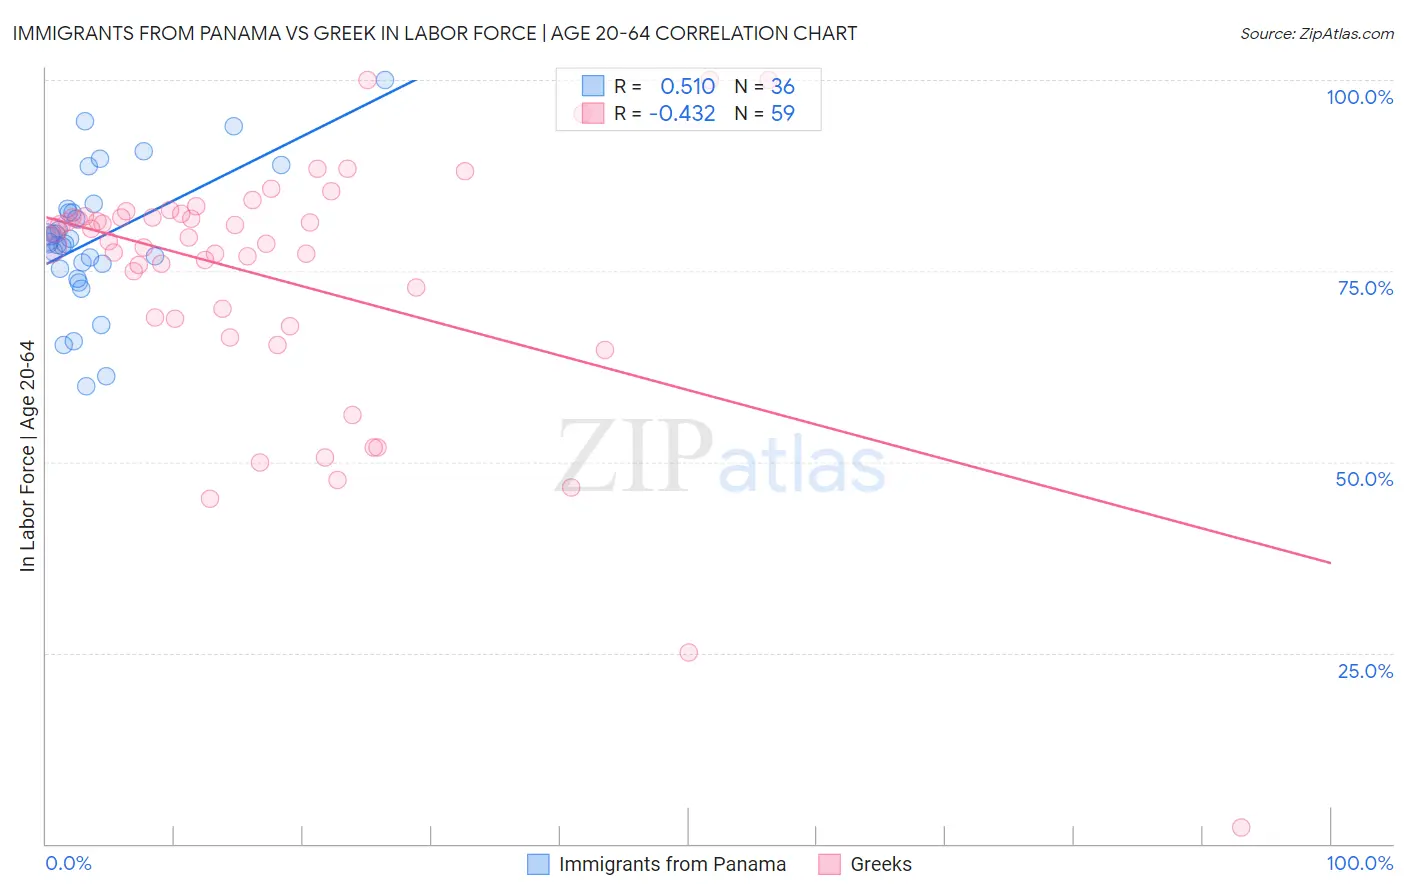
Immigrants from Panama vs Greek In Labor Force | Age 20-64 Correlation Chart

The statistical analysis conducted on geographies consisting of 221,185,422 people shows a substantial positive correlation between the proportion of Immigrants from Panama and labor force participation rate among population between the ages 20 and 64 in the United States with a correlation coefficient (R) of 0.510 and weighted average of 79.1%. Similarly, the statistical analysis conducted on geographies consisting of 482,783,615 people shows a moderate negative correlation between the proportion of Greeks and labor force participation rate among population between the ages 20 and 64 in the United States with a correlation coefficient (R) of -0.432 and weighted average of 80.0%, a difference of 1.1%.
Immigrants from Panama vs Greek In Labor Force | Age 20-64

In Labor Force | Age 20-64 Correlation Summary

MeasurementImmigrants from PanamaGreek
Minimum59.9%2.2%
Maximum100.0%100.0%
Range40.1%97.8%
Mean79.2%74.0%
Median78.9%79.0%
Interquartile 25% (IQ1)75.6%68.7%
Interquartile 75% (IQ3)82.9%82.1%
Interquartile Range (IQR)7.3%13.4%
Standard Deviation (Sample)8.8%17.3%
Standard Deviation (Population)8.7%17.1%

Similar Demographics by In Labor Force | Age 20-64

Demographics Similar to Immigrants from Panama by In Labor Force | Age 20-64

In terms of in labor force | age 20-64, the demographic groups most similar to Immigrants from Panama are Canadian (79.1%, a difference of 0.0%), Immigrants from Uzbekistan (79.1%, a difference of 0.0%), Hungarian (79.2%, a difference of 0.010%), Portuguese (79.1%, a difference of 0.020%), and Immigrants (79.2%, a difference of 0.030%).
DemographicsRating | RankIn Labor Force | Age 20-64
Immigrants | Norway
12.0
/100
|
#215
Poor
79.2%
Arabs
11.4
/100
|
#216
Poor
79.2%
Immigrants | Western Asia
11.0
/100
|
#217
Poor
79.2%
Immigrants | England
9.3
/100
|
#218
Tragic
79.2%
French Canadians
8.4
/100
|
#219
Tragic
79.2%
Immigrants | Immigrants
7.7
/100
|
#220
Tragic
79.2%
Hungarians
7.2
/100
|
#221
Tragic
79.2%
Immigrants | Panama
6.9
/100
|
#222
Tragic
79.1%
Canadians
6.8
/100
|
#223
Tragic
79.1%
Immigrants | Uzbekistan
6.8
/100
|
#224
Tragic
79.1%
Portuguese
6.4
/100
|
#225
Tragic
79.1%
Central Americans
5.9
/100
|
#226
Tragic
79.1%
Immigrants | Western Europe
5.9
/100
|
#227
Tragic
79.1%
Panamanians
5.7
/100
|
#228
Tragic
79.1%
Alsatians
5.7
/100
|
#229
Tragic
79.1%

Demographics Similar to Greeks by In Labor Force | Age 20-64

In terms of in labor force | age 20-64, the demographic groups most similar to Greeks are Immigrants from Jordan (80.0%, a difference of 0.0%), Immigrants from Ghana (80.0%, a difference of 0.010%), Venezuelan (80.0%, a difference of 0.020%), Iranian (80.0%, a difference of 0.020%), and Filipino (80.1%, a difference of 0.030%).
DemographicsRating | RankIn Labor Force | Age 20-64
Immigrants | Chile
95.7
/100
|
#99
Exceptional
80.1%
Filipinos
95.6
/100
|
#100
Exceptional
80.1%
Palestinians
95.5
/100
|
#101
Exceptional
80.0%
Immigrants | Australia
95.5
/100
|
#102
Exceptional
80.0%
Russians
95.5
/100
|
#103
Exceptional
80.0%
Venezuelans
95.3
/100
|
#104
Exceptional
80.0%
Immigrants | Ghana
95.0
/100
|
#105
Exceptional
80.0%
Greeks
94.8
/100
|
#106
Exceptional
80.0%
Immigrants | Jordan
94.8
/100
|
#107
Exceptional
80.0%
Iranians
94.3
/100
|
#108
Exceptional
80.0%
Immigrants | Argentina
94.1
/100
|
#109
Exceptional
80.0%
Estonians
94.0
/100
|
#110
Exceptional
80.0%
Immigrants | South America
93.9
/100
|
#111
Exceptional
80.0%
Immigrants | Italy
93.9
/100
|
#112
Exceptional
80.0%
Sri Lankans
93.9
/100
|
#113
Exceptional
80.0%