Immigrants from Ecuador vs Fijian In Labor Force | Age 20-64
COMPARE
Immigrants from Ecuador
Fijian
In Labor Force | Age 20-64
In Labor Force | Age 20-64 Comparison
Immigrants from Ecuador
Fijians
79.3%
IN LABOR FORCE | AGE 20-64
16.9/ 100
METRIC RATING
206th/ 347
METRIC RANK
78.4%
IN LABOR FORCE | AGE 20-64
0.1/ 100
METRIC RATING
262nd/ 347
METRIC RANK
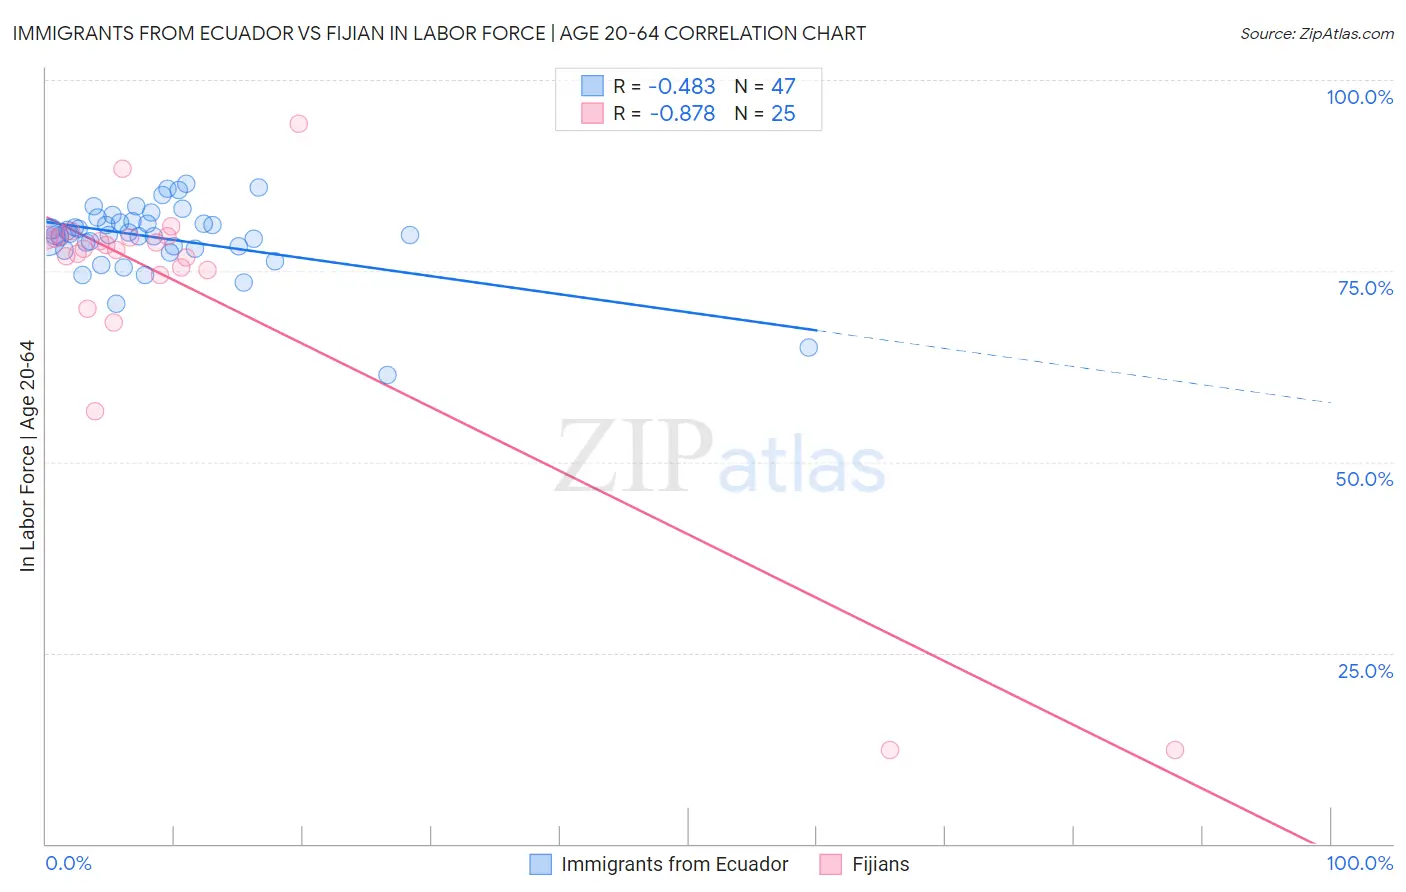
Immigrants from Ecuador vs Fijian In Labor Force | Age 20-64 Correlation Chart
The statistical analysis conducted on geographies consisting of 271,016,720 people shows a moderate negative correlation between the proportion of Immigrants from Ecuador and labor force participation rate among population between the ages 20 and 64 in the United States with a correlation coefficient (R) of -0.483 and weighted average of 79.3%. Similarly, the statistical analysis conducted on geographies consisting of 55,948,069 people shows a very strong negative correlation between the proportion of Fijians and labor force participation rate among population between the ages 20 and 64 in the United States with a correlation coefficient (R) of -0.878 and weighted average of 78.4%, a difference of 1.1%.
In Labor Force | Age 20-64 Correlation Summary
| Measurement | Immigrants from Ecuador | Fijian |
| Minimum | 61.3% | 12.2% |
| Maximum | 86.4% | 94.3% |
| Range | 25.1% | 82.1% |
| Mean | 79.3% | 72.3% |
| Median | 79.7% | 77.9% |
| Interquartile 25% (IQ1) | 77.9% | 74.8% |
| Interquartile 75% (IQ3) | 81.4% | 79.5% |
| Interquartile Range (IQR) | 3.5% | 4.7% |
| Standard Deviation (Sample) | 4.8% | 19.2% |
| Standard Deviation (Population) | 4.7% | 18.9% |
Similar Demographics by In Labor Force | Age 20-64
Demographics Similar to Immigrants from Ecuador by In Labor Force | Age 20-64
In terms of in labor force | age 20-64, the demographic groups most similar to Immigrants from Ecuador are Subsaharan African (79.3%, a difference of 0.0%), Iraqi (79.3%, a difference of 0.010%), Immigrants from Cambodia (79.3%, a difference of 0.010%), Immigrants from Congo (79.3%, a difference of 0.010%), and British (79.3%, a difference of 0.010%).
| Demographics | Rating | Rank | In Labor Force | Age 20-64 |
| Dutch | 20.2 /100 | #199 | Fair 79.3% |
| Immigrants | Oceania | 19.1 /100 | #200 | Poor 79.3% |
| Immigrants | Nicaragua | 19.0 /100 | #201 | Poor 79.3% |
| Nicaraguans | 18.3 /100 | #202 | Poor 79.3% |
| Iraqis | 17.7 /100 | #203 | Poor 79.3% |
| Immigrants | Cambodia | 17.6 /100 | #204 | Poor 79.3% |
| Immigrants | Congo | 17.5 /100 | #205 | Poor 79.3% |
| Immigrants | Ecuador | 16.9 /100 | #206 | Poor 79.3% |
| Sub-Saharan Africans | 16.5 /100 | #207 | Poor 79.3% |
| British | 16.5 /100 | #208 | Poor 79.3% |
| Bangladeshis | 16.4 /100 | #209 | Poor 79.3% |
| Haitians | 16.1 /100 | #210 | Poor 79.3% |
| Europeans | 15.3 /100 | #211 | Poor 79.3% |
| Irish | 13.2 /100 | #212 | Poor 79.3% |
| Immigrants | Portugal | 12.8 /100 | #213 | Poor 79.3% |
Demographics Similar to Fijians by In Labor Force | Age 20-64
In terms of in labor force | age 20-64, the demographic groups most similar to Fijians are Pennsylvania German (78.4%, a difference of 0.010%), Spaniard (78.4%, a difference of 0.020%), British West Indian (78.4%, a difference of 0.060%), Bahamian (78.4%, a difference of 0.060%), and U.S. Virgin Islander (78.4%, a difference of 0.080%).
| Demographics | Rating | Rank | In Labor Force | Age 20-64 |
| Hawaiians | 0.5 /100 | #255 | Tragic 78.7% |
| Celtics | 0.5 /100 | #256 | Tragic 78.7% |
| Guatemalans | 0.4 /100 | #257 | Tragic 78.7% |
| Immigrants | Guatemala | 0.4 /100 | #258 | Tragic 78.7% |
| Tsimshian | 0.4 /100 | #259 | Tragic 78.7% |
| Immigrants | Fiji | 0.3 /100 | #260 | Tragic 78.6% |
| Whites/Caucasians | 0.2 /100 | #261 | Tragic 78.5% |
| Fijians | 0.1 /100 | #262 | Tragic 78.4% |
| Pennsylvania Germans | 0.1 /100 | #263 | Tragic 78.4% |
| Spaniards | 0.1 /100 | #264 | Tragic 78.4% |
| British West Indians | 0.1 /100 | #265 | Tragic 78.4% |
| Bahamians | 0.1 /100 | #266 | Tragic 78.4% |
| U.S. Virgin Islanders | 0.1 /100 | #267 | Tragic 78.4% |
| West Indians | 0.0 /100 | #268 | Tragic 78.3% |
| Immigrants | Barbados | 0.0 /100 | #269 | Tragic 78.3% |