Immigrants from Sri Lanka vs Marshallese In Labor Force | Age 30-34
COMPARE
Immigrants from Sri Lanka
Marshallese
In Labor Force | Age 30-34
In Labor Force | Age 30-34 Comparison
Immigrants from Sri Lanka
Marshallese
85.6%
IN LABOR FORCE | AGE 30-34
99.8/ 100
METRIC RATING
44th/ 347
METRIC RANK
79.2%
IN LABOR FORCE | AGE 30-34
0.0/ 100
METRIC RATING
335th/ 347
METRIC RANK
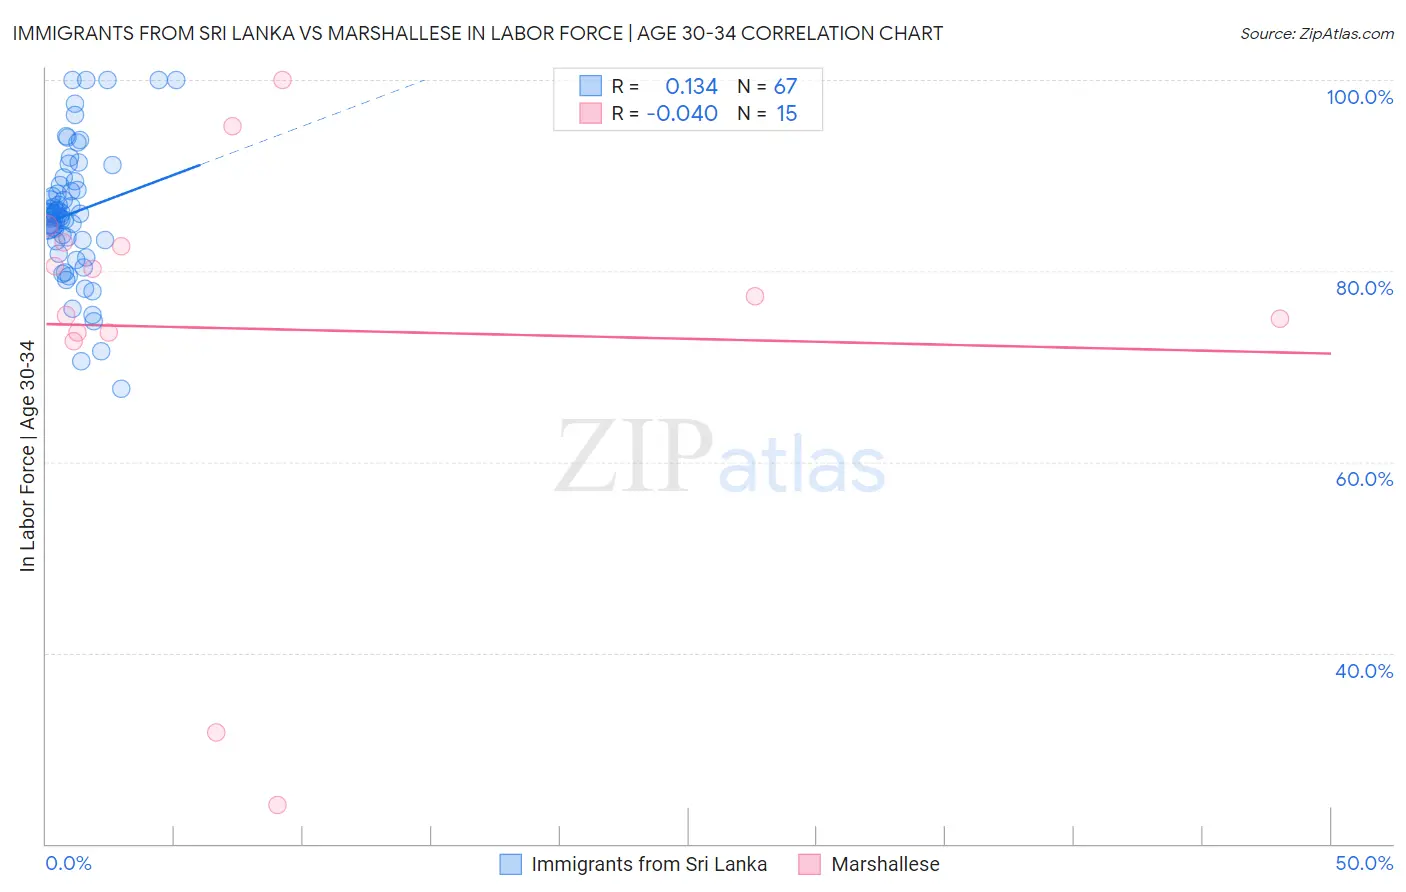
Immigrants from Sri Lanka vs Marshallese In Labor Force | Age 30-34 Correlation Chart
The statistical analysis conducted on geographies consisting of 149,680,449 people shows a poor positive correlation between the proportion of Immigrants from Sri Lanka and labor force participation rate among population between the ages 30 and 34 in the United States with a correlation coefficient (R) of 0.134 and weighted average of 85.6%. Similarly, the statistical analysis conducted on geographies consisting of 14,760,991 people shows no correlation between the proportion of Marshallese and labor force participation rate among population between the ages 30 and 34 in the United States with a correlation coefficient (R) of -0.040 and weighted average of 79.2%, a difference of 8.1%.
In Labor Force | Age 30-34 Correlation Summary
| Measurement | Immigrants from Sri Lanka | Marshallese |
| Minimum | 67.7% | 24.0% |
| Maximum | 100.0% | 100.0% |
| Range | 32.3% | 76.0% |
| Mean | 86.1% | 73.9% |
| Median | 85.9% | 77.3% |
| Interquartile 25% (IQ1) | 83.2% | 73.5% |
| Interquartile 75% (IQ3) | 89.4% | 82.9% |
| Interquartile Range (IQR) | 6.2% | 9.4% |
| Standard Deviation (Sample) | 7.0% | 20.3% |
| Standard Deviation (Population) | 6.9% | 19.6% |
Similar Demographics by In Labor Force | Age 30-34
Demographics Similar to Immigrants from Sri Lanka by In Labor Force | Age 30-34
In terms of in labor force | age 30-34, the demographic groups most similar to Immigrants from Sri Lanka are Immigrants from Nepal (85.6%, a difference of 0.010%), Immigrants from Morocco (85.6%, a difference of 0.010%), Croatian (85.6%, a difference of 0.010%), Zimbabwean (85.6%, a difference of 0.030%), and Immigrants from Lithuania (85.6%, a difference of 0.030%).
| Demographics | Rating | Rank | In Labor Force | Age 30-34 |
| Norwegians | 99.9 /100 | #37 | Exceptional 85.7% |
| Immigrants | Greece | 99.9 /100 | #38 | Exceptional 85.7% |
| Eastern Europeans | 99.9 /100 | #39 | Exceptional 85.7% |
| Turks | 99.9 /100 | #40 | Exceptional 85.7% |
| Immigrants | Italy | 99.9 /100 | #41 | Exceptional 85.7% |
| Zimbabweans | 99.8 /100 | #42 | Exceptional 85.6% |
| Immigrants | Lithuania | 99.8 /100 | #43 | Exceptional 85.6% |
| Immigrants | Sri Lanka | 99.8 /100 | #44 | Exceptional 85.6% |
| Immigrants | Nepal | 99.8 /100 | #45 | Exceptional 85.6% |
| Immigrants | Morocco | 99.8 /100 | #46 | Exceptional 85.6% |
| Croatians | 99.8 /100 | #47 | Exceptional 85.6% |
| Immigrants | Sweden | 99.8 /100 | #48 | Exceptional 85.6% |
| Lithuanians | 99.8 /100 | #49 | Exceptional 85.6% |
| Immigrants | Australia | 99.8 /100 | #50 | Exceptional 85.6% |
| Cape Verdeans | 99.7 /100 | #51 | Exceptional 85.6% |
Demographics Similar to Marshallese by In Labor Force | Age 30-34
In terms of in labor force | age 30-34, the demographic groups most similar to Marshallese are Hopi (79.3%, a difference of 0.030%), Native/Alaskan (79.2%, a difference of 0.080%), Yakama (79.1%, a difference of 0.12%), Pima (79.0%, a difference of 0.24%), and Apache (79.0%, a difference of 0.27%).
| Demographics | Rating | Rank | In Labor Force | Age 30-34 |
| Sioux | 0.0 /100 | #328 | Tragic 80.4% |
| Creek | 0.0 /100 | #329 | Tragic 80.4% |
| Pueblo | 0.0 /100 | #330 | Tragic 80.0% |
| Houma | 0.0 /100 | #331 | Tragic 79.9% |
| Kiowa | 0.0 /100 | #332 | Tragic 79.8% |
| Inupiat | 0.0 /100 | #333 | Tragic 79.7% |
| Hopi | 0.0 /100 | #334 | Tragic 79.3% |
| Marshallese | 0.0 /100 | #335 | Tragic 79.2% |
| Natives/Alaskans | 0.0 /100 | #336 | Tragic 79.2% |
| Yakama | 0.0 /100 | #337 | Tragic 79.1% |
| Pima | 0.0 /100 | #338 | Tragic 79.0% |
| Apache | 0.0 /100 | #339 | Tragic 79.0% |
| Ute | 0.0 /100 | #340 | Tragic 78.9% |
| Immigrants | Yemen | 0.0 /100 | #341 | Tragic 78.2% |
| Tohono O'odham | 0.0 /100 | #342 | Tragic 77.7% |