Immigrants from Norway vs Bangladeshi In Labor Force | Age 35-44
COMPARE
Immigrants from Norway
Bangladeshi
In Labor Force | Age 35-44
In Labor Force | Age 35-44 Comparison
Immigrants from Norway
Bangladeshis
84.1%
IN LABOR FORCE | AGE 35-44
11.7/ 100
METRIC RATING
217th/ 347
METRIC RANK
84.1%
IN LABOR FORCE | AGE 35-44
13.7/ 100
METRIC RATING
213th/ 347
METRIC RANK
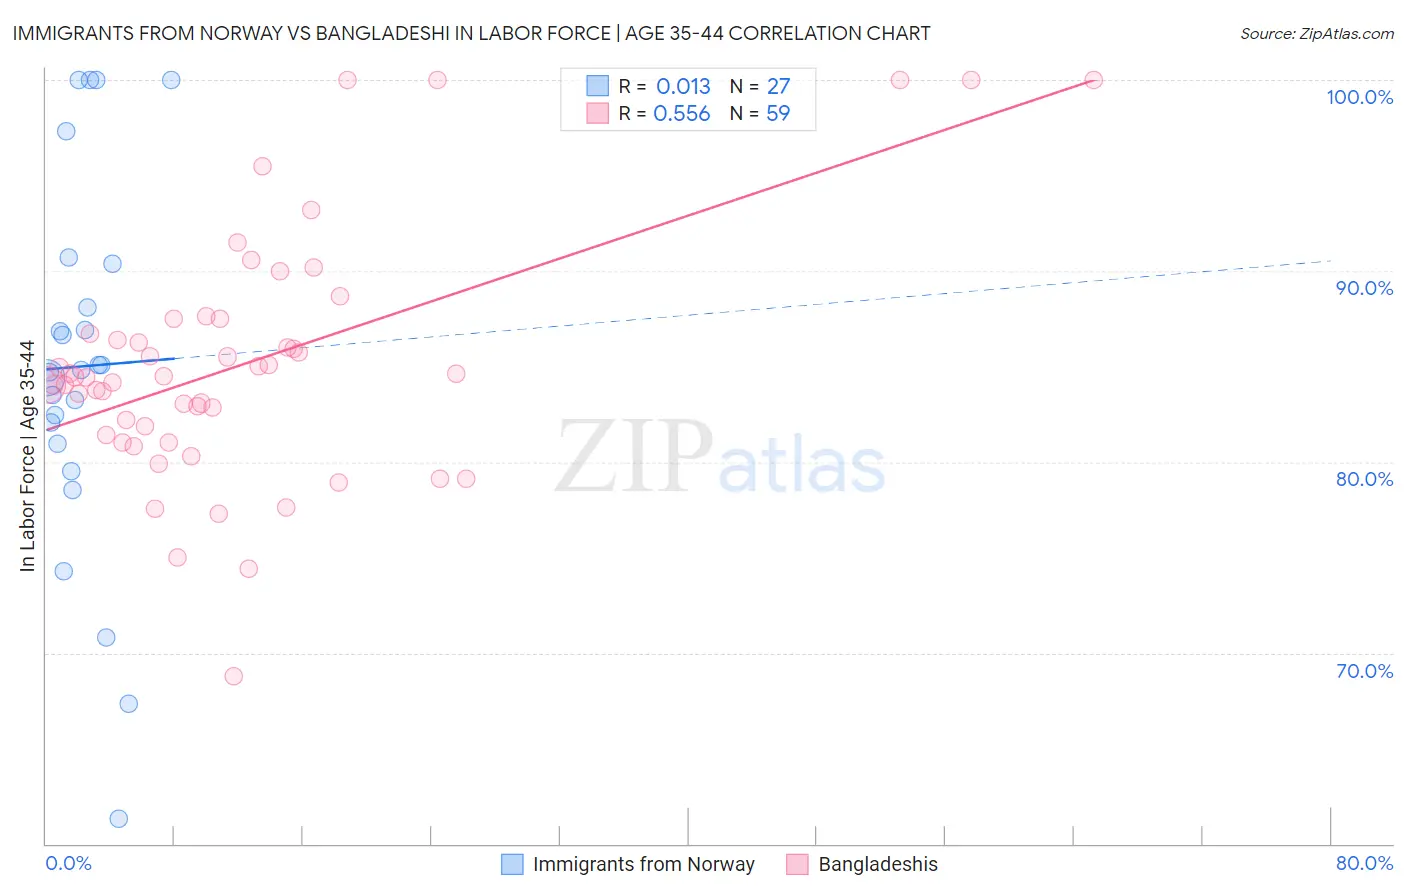
Immigrants from Norway vs Bangladeshi In Labor Force | Age 35-44 Correlation Chart
The statistical analysis conducted on geographies consisting of 116,704,105 people shows no correlation between the proportion of Immigrants from Norway and labor force participation rate among population between the ages 35 and 44 in the United States with a correlation coefficient (R) of 0.013 and weighted average of 84.1%. Similarly, the statistical analysis conducted on geographies consisting of 141,407,561 people shows a substantial positive correlation between the proportion of Bangladeshis and labor force participation rate among population between the ages 35 and 44 in the United States with a correlation coefficient (R) of 0.556 and weighted average of 84.1%, a difference of 0.030%.
In Labor Force | Age 35-44 Correlation Summary
| Measurement | Immigrants from Norway | Bangladeshi |
| Minimum | 61.3% | 68.7% |
| Maximum | 100.0% | 100.0% |
| Range | 38.7% | 31.3% |
| Mean | 85.0% | 85.1% |
| Median | 84.8% | 84.5% |
| Interquartile 25% (IQ1) | 80.9% | 81.4% |
| Interquartile 75% (IQ3) | 90.4% | 87.5% |
| Interquartile Range (IQR) | 9.5% | 6.0% |
| Standard Deviation (Sample) | 9.7% | 6.4% |
| Standard Deviation (Population) | 9.5% | 6.3% |
Demographics Similar to Immigrants from Norway and Bangladeshis by In Labor Force | Age 35-44
In terms of in labor force | age 35-44, the demographic groups most similar to Immigrants from Norway are European (84.1%, a difference of 0.010%), Nicaraguan (84.1%, a difference of 0.010%), Immigrants from Barbados (84.1%, a difference of 0.020%), Israeli (84.1%, a difference of 0.030%), and Immigrants from Nicaragua (84.1%, a difference of 0.040%). Similarly, the demographic groups most similar to Bangladeshis are Israeli (84.1%, a difference of 0.0%), Immigrants from Barbados (84.1%, a difference of 0.010%), Immigrants from Ecuador (84.1%, a difference of 0.020%), European (84.1%, a difference of 0.020%), and Nicaraguan (84.1%, a difference of 0.020%).
| Demographics | Rating | Rank | In Labor Force | Age 35-44 |
| Immigrants | Canada | 19.6 /100 | #205 | Poor 84.2% |
| Immigrants | Costa Rica | 19.5 /100 | #206 | Poor 84.2% |
| Laotians | 19.0 /100 | #207 | Poor 84.2% |
| Immigrants | North America | 18.1 /100 | #208 | Poor 84.2% |
| Swiss | 17.4 /100 | #209 | Poor 84.2% |
| New Zealanders | 16.2 /100 | #210 | Poor 84.1% |
| Immigrants | Ecuador | 15.2 /100 | #211 | Poor 84.1% |
| Israelis | 14.0 /100 | #212 | Poor 84.1% |
| Bangladeshis | 13.7 /100 | #213 | Poor 84.1% |
| Immigrants | Barbados | 13.2 /100 | #214 | Poor 84.1% |
| Europeans | 12.2 /100 | #215 | Poor 84.1% |
| Nicaraguans | 12.1 /100 | #216 | Poor 84.1% |
| Immigrants | Norway | 11.7 /100 | #217 | Poor 84.1% |
| Immigrants | Nicaragua | 9.4 /100 | #218 | Tragic 84.1% |
| Sub-Saharan Africans | 9.3 /100 | #219 | Tragic 84.1% |
| French | 7.5 /100 | #220 | Tragic 84.0% |
| Icelanders | 6.7 /100 | #221 | Tragic 84.0% |
| Assyrians/Chaldeans/Syriacs | 6.6 /100 | #222 | Tragic 84.0% |
| Immigrants | Panama | 6.4 /100 | #223 | Tragic 84.0% |
| U.S. Virgin Islanders | 6.1 /100 | #224 | Tragic 84.0% |
| Immigrants | Burma/Myanmar | 6.1 /100 | #225 | Tragic 84.0% |