Laotian vs Swiss In Labor Force | Age 20-24
COMPARE
Laotian
Swiss
In Labor Force | Age 20-24
In Labor Force | Age 20-24 Comparison
Laotians
Swiss
74.1%
IN LABOR FORCE | AGE 20-24
3.5/ 100
METRIC RATING
235th/ 347
METRIC RANK
77.7%
IN LABOR FORCE | AGE 20-24
100.0/ 100
METRIC RATING
30th/ 347
METRIC RANK
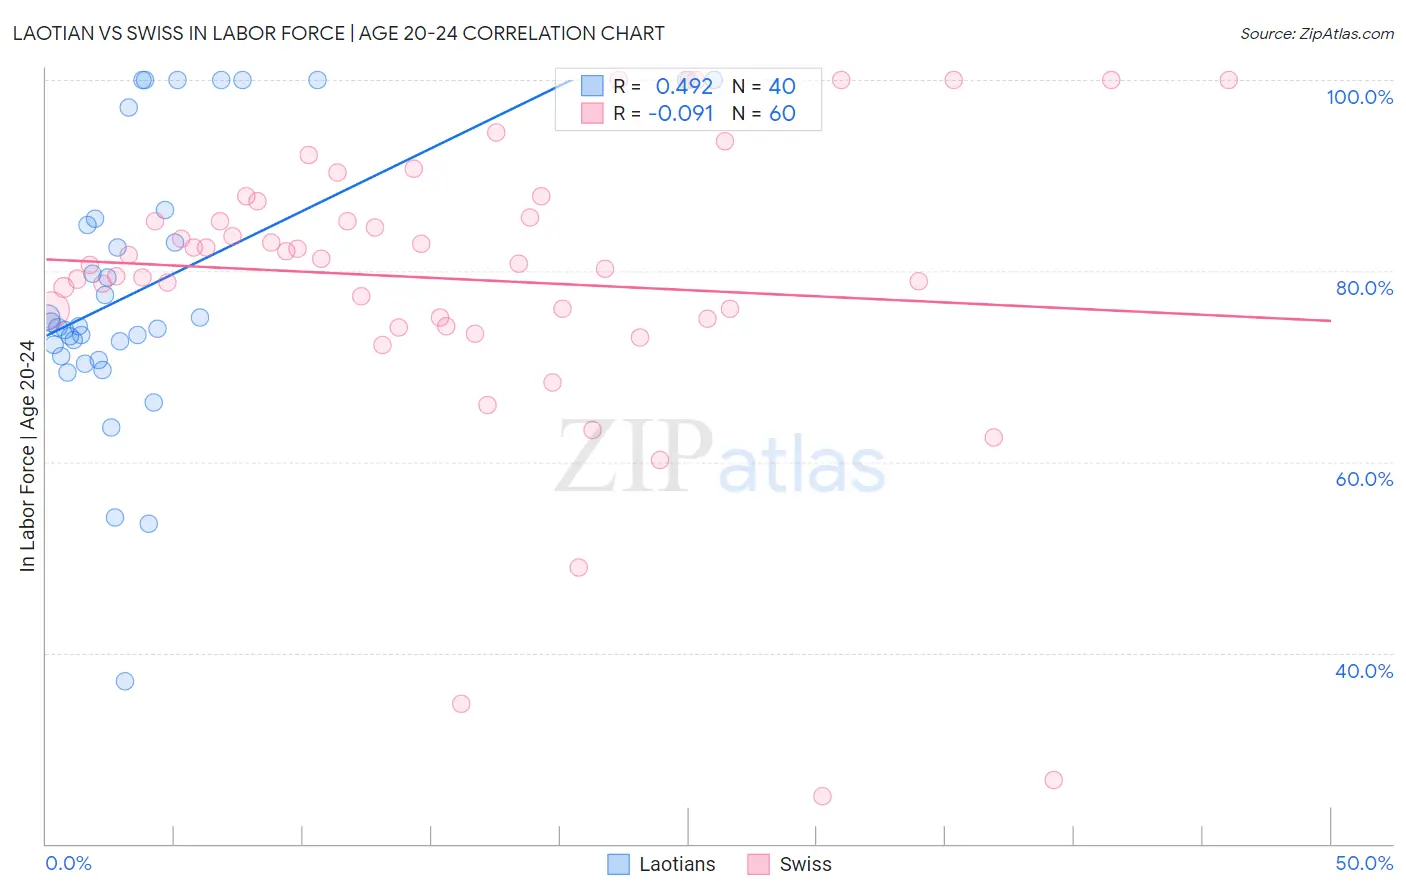
Laotian vs Swiss In Labor Force | Age 20-24 Correlation Chart
The statistical analysis conducted on geographies consisting of 224,808,189 people shows a moderate positive correlation between the proportion of Laotians and labor force participation rate among population between the ages 20 and 24 in the United States with a correlation coefficient (R) of 0.492 and weighted average of 74.1%. Similarly, the statistical analysis conducted on geographies consisting of 464,562,174 people shows a slight negative correlation between the proportion of Swiss and labor force participation rate among population between the ages 20 and 24 in the United States with a correlation coefficient (R) of -0.091 and weighted average of 77.7%, a difference of 4.8%.
In Labor Force | Age 20-24 Correlation Summary
| Measurement | Laotian | Swiss |
| Minimum | 37.0% | 25.0% |
| Maximum | 100.0% | 100.0% |
| Range | 63.0% | 75.0% |
| Mean | 78.5% | 79.1% |
| Median | 74.4% | 81.0% |
| Interquartile 25% (IQ1) | 71.6% | 75.0% |
| Interquartile 75% (IQ3) | 85.9% | 86.5% |
| Interquartile Range (IQR) | 14.3% | 11.4% |
| Standard Deviation (Sample) | 14.5% | 15.6% |
| Standard Deviation (Population) | 14.3% | 15.5% |
Similar Demographics by In Labor Force | Age 20-24
Demographics Similar to Laotians by In Labor Force | Age 20-24
In terms of in labor force | age 20-24, the demographic groups most similar to Laotians are Immigrants (74.1%, a difference of 0.010%), Immigrants from Chile (74.1%, a difference of 0.020%), Immigrants from France (74.1%, a difference of 0.020%), Bermudan (74.1%, a difference of 0.030%), and Immigrants from Switzerland (74.2%, a difference of 0.060%).
| Demographics | Rating | Rank | In Labor Force | Age 20-24 |
| Immigrants | Ukraine | 5.1 /100 | #228 | Tragic 74.2% |
| Immigrants | Sweden | 4.6 /100 | #229 | Tragic 74.2% |
| Immigrants | Albania | 4.3 /100 | #230 | Tragic 74.2% |
| Immigrants | Greece | 4.1 /100 | #231 | Tragic 74.2% |
| Immigrants | Switzerland | 4.1 /100 | #232 | Tragic 74.2% |
| Immigrants | Chile | 3.7 /100 | #233 | Tragic 74.1% |
| Immigrants | Immigrants | 3.6 /100 | #234 | Tragic 74.1% |
| Laotians | 3.5 /100 | #235 | Tragic 74.1% |
| Immigrants | France | 3.3 /100 | #236 | Tragic 74.1% |
| Bermudans | 3.2 /100 | #237 | Tragic 74.1% |
| Immigrants | Japan | 3.0 /100 | #238 | Tragic 74.1% |
| Immigrants | Latin America | 2.7 /100 | #239 | Tragic 74.1% |
| Immigrants | Sri Lanka | 2.3 /100 | #240 | Tragic 74.0% |
| Immigrants | Senegal | 2.1 /100 | #241 | Tragic 74.0% |
| Thais | 2.1 /100 | #242 | Tragic 74.0% |
Demographics Similar to Swiss by In Labor Force | Age 20-24
In terms of in labor force | age 20-24, the demographic groups most similar to Swiss are Slovak (77.7%, a difference of 0.020%), Belgian (77.8%, a difference of 0.10%), Polish (77.6%, a difference of 0.12%), Immigrants from Micronesia (77.8%, a difference of 0.14%), and English (77.6%, a difference of 0.18%).
| Demographics | Rating | Rank | In Labor Force | Age 20-24 |
| Yugoslavians | 100.0 /100 | #23 | Exceptional 78.0% |
| Liberians | 100.0 /100 | #24 | Exceptional 78.0% |
| Tlingit-Haida | 100.0 /100 | #25 | Exceptional 77.9% |
| Tongans | 100.0 /100 | #26 | Exceptional 77.9% |
| Immigrants | Micronesia | 100.0 /100 | #27 | Exceptional 77.8% |
| Belgians | 100.0 /100 | #28 | Exceptional 77.8% |
| Slovaks | 100.0 /100 | #29 | Exceptional 77.7% |
| Swiss | 100.0 /100 | #30 | Exceptional 77.7% |
| Poles | 100.0 /100 | #31 | Exceptional 77.6% |
| English | 100.0 /100 | #32 | Exceptional 77.6% |
| Immigrants | Ethiopia | 100.0 /100 | #33 | Exceptional 77.5% |
| German Russians | 100.0 /100 | #34 | Exceptional 77.5% |
| Immigrants | Eastern Africa | 100.0 /100 | #35 | Exceptional 77.5% |
| Welsh | 100.0 /100 | #36 | Exceptional 77.5% |
| Czechoslovakians | 100.0 /100 | #37 | Exceptional 77.5% |