Immigrants from North Macedonia vs Immigrants from Guyana In Labor Force | Age 20-24
COMPARE
Immigrants from North Macedonia
Immigrants from Guyana
In Labor Force | Age 20-24
In Labor Force | Age 20-24 Comparison
Immigrants from North Macedonia
Immigrants from Guyana
76.1%
IN LABOR FORCE | AGE 20-24
97.5/ 100
METRIC RATING
103rd/ 347
METRIC RANK
69.3%
IN LABOR FORCE | AGE 20-24
0.0/ 100
METRIC RATING
336th/ 347
METRIC RANK
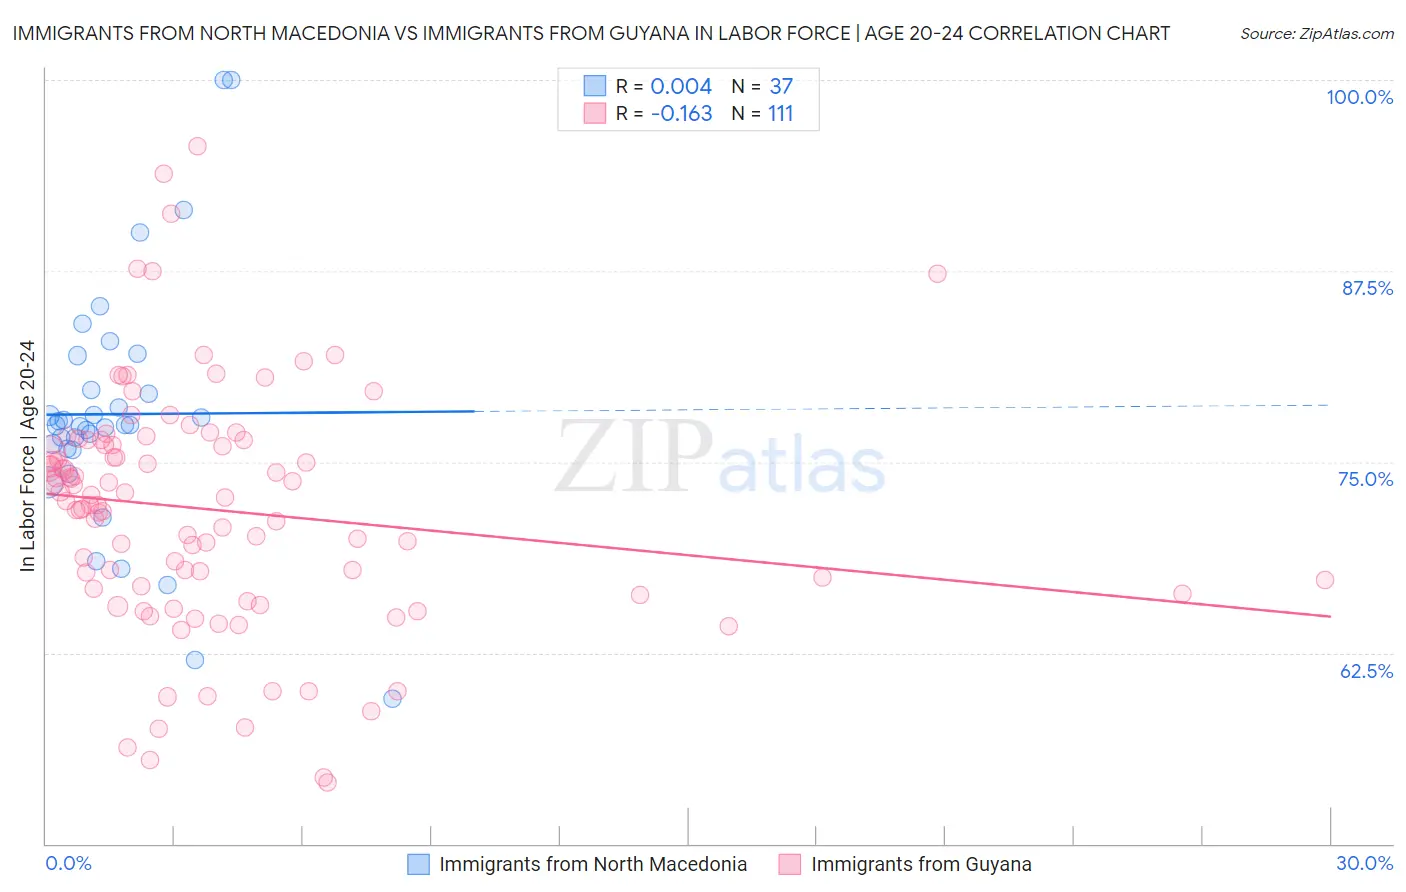
Immigrants from North Macedonia vs Immigrants from Guyana In Labor Force | Age 20-24 Correlation Chart
The statistical analysis conducted on geographies consisting of 74,315,577 people shows no correlation between the proportion of Immigrants from North Macedonia and labor force participation rate among population between the ages 20 and 24 in the United States with a correlation coefficient (R) of 0.004 and weighted average of 76.1%. Similarly, the statistical analysis conducted on geographies consisting of 183,673,917 people shows a poor negative correlation between the proportion of Immigrants from Guyana and labor force participation rate among population between the ages 20 and 24 in the United States with a correlation coefficient (R) of -0.163 and weighted average of 69.3%, a difference of 9.8%.
In Labor Force | Age 20-24 Correlation Summary
| Measurement | Immigrants from North Macedonia | Immigrants from Guyana |
| Minimum | 59.5% | 54.0% |
| Maximum | 100.0% | 95.7% |
| Range | 40.5% | 41.7% |
| Mean | 78.1% | 71.9% |
| Median | 77.4% | 72.4% |
| Interquartile 25% (IQ1) | 75.8% | 66.7% |
| Interquartile 75% (IQ3) | 80.8% | 76.4% |
| Interquartile Range (IQR) | 5.0% | 9.7% |
| Standard Deviation (Sample) | 8.3% | 7.9% |
| Standard Deviation (Population) | 8.1% | 7.8% |
Similar Demographics by In Labor Force | Age 20-24
Demographics Similar to Immigrants from North Macedonia by In Labor Force | Age 20-24
In terms of in labor force | age 20-24, the demographic groups most similar to Immigrants from North Macedonia are Latvian (76.1%, a difference of 0.020%), Immigrants from Poland (76.1%, a difference of 0.030%), Shoshone (76.1%, a difference of 0.040%), Macedonian (76.0%, a difference of 0.040%), and Immigrants from Nepal (76.0%, a difference of 0.040%).
| Demographics | Rating | Rank | In Labor Force | Age 20-24 |
| Immigrants | Nonimmigrants | 98.5 /100 | #96 | Exceptional 76.2% |
| Immigrants | Lithuania | 98.0 /100 | #97 | Exceptional 76.1% |
| Immigrants | Oceania | 98.0 /100 | #98 | Exceptional 76.1% |
| Americans | 97.8 /100 | #99 | Exceptional 76.1% |
| Shoshone | 97.8 /100 | #100 | Exceptional 76.1% |
| Immigrants | Poland | 97.7 /100 | #101 | Exceptional 76.1% |
| Latvians | 97.6 /100 | #102 | Exceptional 76.1% |
| Immigrants | North Macedonia | 97.5 /100 | #103 | Exceptional 76.1% |
| Macedonians | 97.2 /100 | #104 | Exceptional 76.0% |
| Immigrants | Nepal | 97.2 /100 | #105 | Exceptional 76.0% |
| Immigrants | Uganda | 97.1 /100 | #106 | Exceptional 76.0% |
| Greeks | 96.9 /100 | #107 | Exceptional 76.0% |
| Iraqis | 96.6 /100 | #108 | Exceptional 76.0% |
| Cherokee | 95.8 /100 | #109 | Exceptional 75.9% |
| Immigrants | Morocco | 95.8 /100 | #110 | Exceptional 75.9% |
Demographics Similar to Immigrants from Guyana by In Labor Force | Age 20-24
In terms of in labor force | age 20-24, the demographic groups most similar to Immigrants from Guyana are Guyanese (69.2%, a difference of 0.13%), Pima (69.0%, a difference of 0.39%), Immigrants from Yemen (68.9%, a difference of 0.52%), Immigrants from Barbados (69.7%, a difference of 0.66%), and Menominee (68.7%, a difference of 0.83%).
| Demographics | Rating | Rank | In Labor Force | Age 20-24 |
| Yup'ik | 0.0 /100 | #329 | Tragic 70.9% |
| Vietnamese | 0.0 /100 | #330 | Tragic 70.6% |
| Immigrants | Bangladesh | 0.0 /100 | #331 | Tragic 70.6% |
| Immigrants | Uzbekistan | 0.0 /100 | #332 | Tragic 70.4% |
| Yuman | 0.0 /100 | #333 | Tragic 70.3% |
| British West Indians | 0.0 /100 | #334 | Tragic 70.0% |
| Immigrants | Barbados | 0.0 /100 | #335 | Tragic 69.7% |
| Immigrants | Guyana | 0.0 /100 | #336 | Tragic 69.3% |
| Guyanese | 0.0 /100 | #337 | Tragic 69.2% |
| Pima | 0.0 /100 | #338 | Tragic 69.0% |
| Immigrants | Yemen | 0.0 /100 | #339 | Tragic 68.9% |
| Menominee | 0.0 /100 | #340 | Tragic 68.7% |
| Tohono O'odham | 0.0 /100 | #341 | Tragic 68.6% |
| Immigrants | St. Vincent and the Grenadines | 0.0 /100 | #342 | Tragic 68.4% |
| Puerto Ricans | 0.0 /100 | #343 | Tragic 68.3% |