Native Hawaiian vs Swedish In Labor Force | Age 20-64
COMPARE
Native Hawaiian
Swedish
In Labor Force | Age 20-64
In Labor Force | Age 20-64 Comparison
Native Hawaiians
Swedes
79.1%
IN LABOR FORCE | AGE 20-64
5.6/ 100
METRIC RATING
230th/ 347
METRIC RANK
80.3%
IN LABOR FORCE | AGE 20-64
98.9/ 100
METRIC RATING
59th/ 347
METRIC RANK
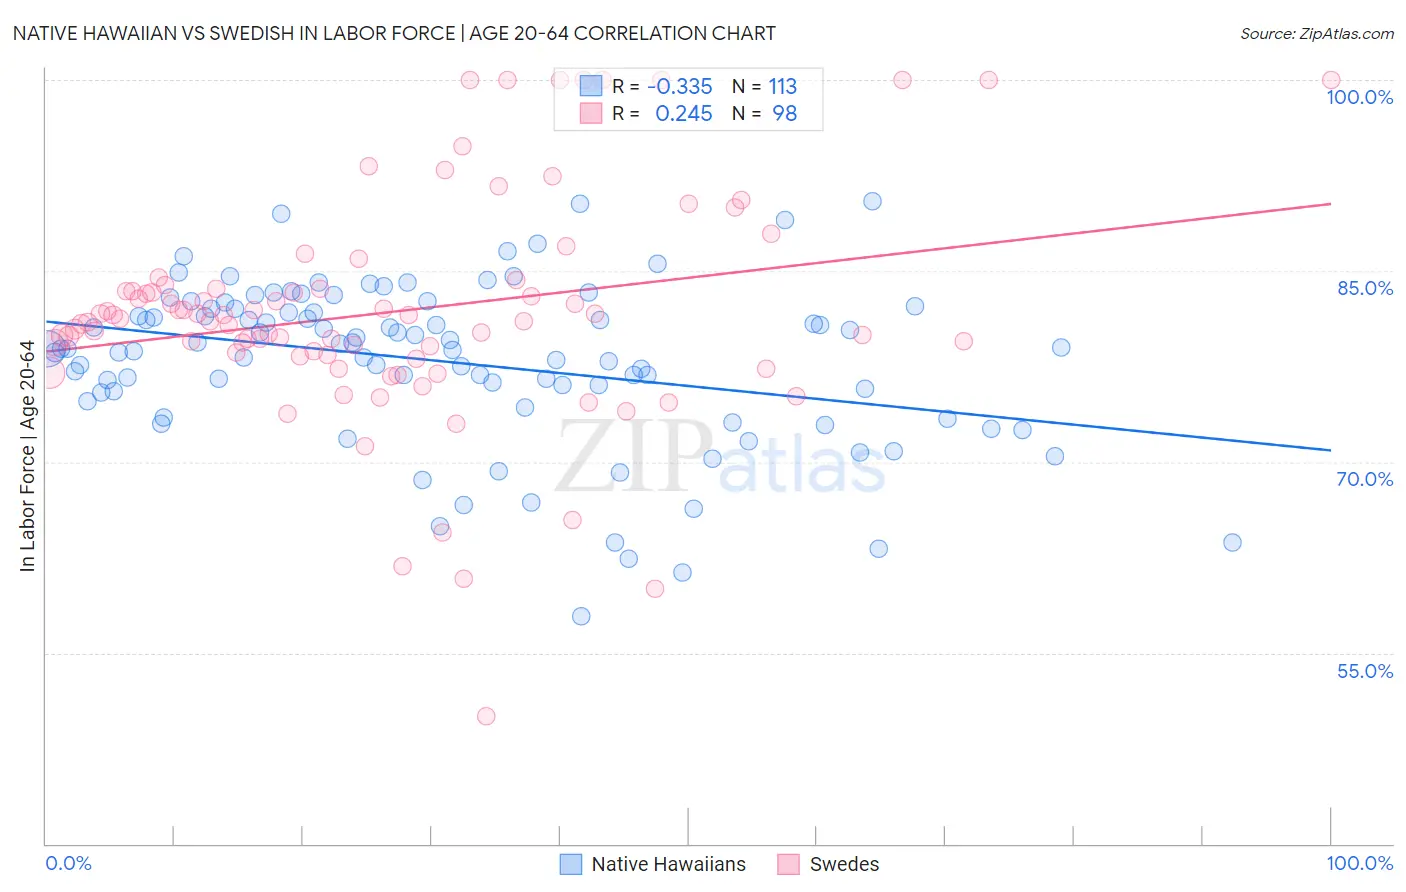
Native Hawaiian vs Swedish In Labor Force | Age 20-64 Correlation Chart
The statistical analysis conducted on geographies consisting of 332,116,366 people shows a mild negative correlation between the proportion of Native Hawaiians and labor force participation rate among population between the ages 20 and 64 in the United States with a correlation coefficient (R) of -0.335 and weighted average of 79.1%. Similarly, the statistical analysis conducted on geographies consisting of 539,244,386 people shows a weak positive correlation between the proportion of Swedes and labor force participation rate among population between the ages 20 and 64 in the United States with a correlation coefficient (R) of 0.245 and weighted average of 80.3%, a difference of 1.5%.
In Labor Force | Age 20-64 Correlation Summary
| Measurement | Native Hawaiian | Swedish |
| Minimum | 57.9% | 50.0% |
| Maximum | 90.5% | 100.0% |
| Range | 32.6% | 50.0% |
| Mean | 77.9% | 81.8% |
| Median | 78.9% | 81.2% |
| Interquartile 25% (IQ1) | 75.1% | 78.4% |
| Interquartile 75% (IQ3) | 82.0% | 83.6% |
| Interquartile Range (IQR) | 6.9% | 5.2% |
| Standard Deviation (Sample) | 6.4% | 8.9% |
| Standard Deviation (Population) | 6.3% | 8.9% |
Similar Demographics by In Labor Force | Age 20-64
Demographics Similar to Native Hawaiians by In Labor Force | Age 20-64
In terms of in labor force | age 20-64, the demographic groups most similar to Native Hawaiians are Panamanian (79.1%, a difference of 0.0%), Alsatian (79.1%, a difference of 0.0%), Central American (79.1%, a difference of 0.010%), Immigrants from Western Europe (79.1%, a difference of 0.010%), and Lebanese (79.1%, a difference of 0.020%).
| Demographics | Rating | Rank | In Labor Force | Age 20-64 |
| Canadians | 6.8 /100 | #223 | Tragic 79.1% |
| Immigrants | Uzbekistan | 6.8 /100 | #224 | Tragic 79.1% |
| Portuguese | 6.4 /100 | #225 | Tragic 79.1% |
| Central Americans | 5.9 /100 | #226 | Tragic 79.1% |
| Immigrants | Western Europe | 5.9 /100 | #227 | Tragic 79.1% |
| Panamanians | 5.7 /100 | #228 | Tragic 79.1% |
| Alsatians | 5.7 /100 | #229 | Tragic 79.1% |
| Native Hawaiians | 5.6 /100 | #230 | Tragic 79.1% |
| Lebanese | 5.1 /100 | #231 | Tragic 79.1% |
| Guamanians/Chamorros | 4.5 /100 | #232 | Tragic 79.1% |
| Japanese | 4.0 /100 | #233 | Tragic 79.1% |
| Immigrants | Canada | 3.2 /100 | #234 | Tragic 79.0% |
| Tlingit-Haida | 3.2 /100 | #235 | Tragic 79.0% |
| Samoans | 2.9 /100 | #236 | Tragic 79.0% |
| Immigrants | North America | 2.9 /100 | #237 | Tragic 79.0% |
Demographics Similar to Swedes by In Labor Force | Age 20-64
In terms of in labor force | age 20-64, the demographic groups most similar to Swedes are Serbian (80.3%, a difference of 0.0%), Tongan (80.3%, a difference of 0.0%), Afghan (80.3%, a difference of 0.010%), Burmese (80.3%, a difference of 0.010%), and Carpatho Rusyn (80.3%, a difference of 0.010%).
| Demographics | Rating | Rank | In Labor Force | Age 20-64 |
| Turks | 99.2 /100 | #52 | Exceptional 80.3% |
| Immigrants | Peru | 99.2 /100 | #53 | Exceptional 80.3% |
| Peruvians | 99.1 /100 | #54 | Exceptional 80.3% |
| Immigrants | Cabo Verde | 99.0 /100 | #55 | Exceptional 80.3% |
| Immigrants | Northern Africa | 99.0 /100 | #56 | Exceptional 80.3% |
| Afghans | 98.9 /100 | #57 | Exceptional 80.3% |
| Serbians | 98.9 /100 | #58 | Exceptional 80.3% |
| Swedes | 98.9 /100 | #59 | Exceptional 80.3% |
| Tongans | 98.8 /100 | #60 | Exceptional 80.3% |
| Burmese | 98.8 /100 | #61 | Exceptional 80.3% |
| Carpatho Rusyns | 98.8 /100 | #62 | Exceptional 80.3% |
| Immigrants | Korea | 98.8 /100 | #63 | Exceptional 80.3% |
| Immigrants | Albania | 98.7 /100 | #64 | Exceptional 80.3% |
| Lithuanians | 98.7 /100 | #65 | Exceptional 80.2% |
| Macedonians | 98.7 /100 | #66 | Exceptional 80.2% |