Immigrants from North America vs Immigrants from Bolivia In Labor Force | Age 35-44
COMPARE
Immigrants from North America
Immigrants from Bolivia
In Labor Force | Age 35-44
In Labor Force | Age 35-44 Comparison
Immigrants from North America
Immigrants from Bolivia
84.2%
IN LABOR FORCE | AGE 35-44
18.1/ 100
METRIC RATING
208th/ 347
METRIC RANK
86.2%
IN LABOR FORCE | AGE 35-44
100.0/ 100
METRIC RATING
3rd/ 347
METRIC RANK
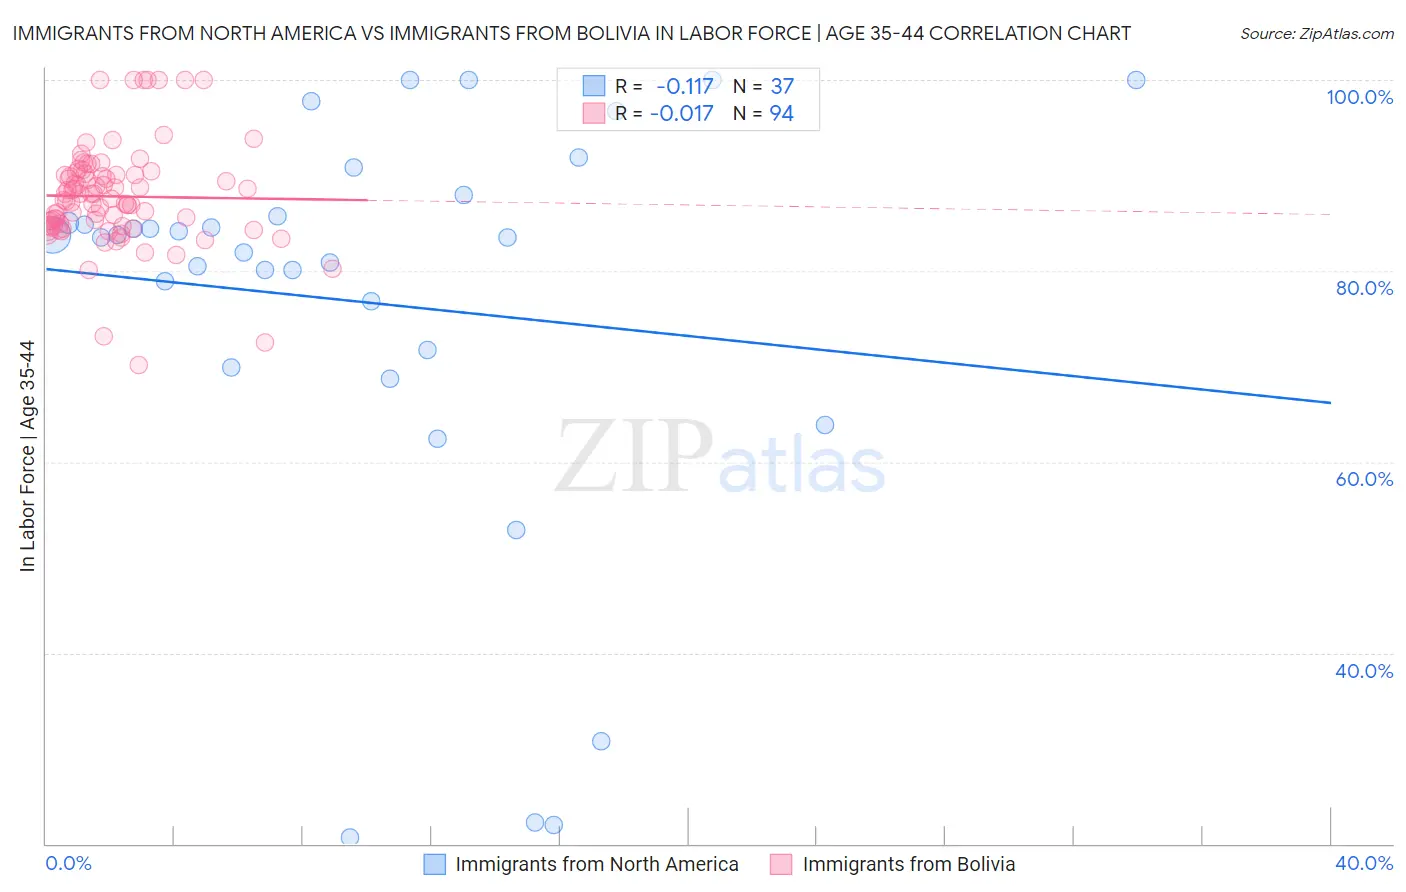
Immigrants from North America vs Immigrants from Bolivia In Labor Force | Age 35-44 Correlation Chart
The statistical analysis conducted on geographies consisting of 462,208,516 people shows a poor negative correlation between the proportion of Immigrants from North America and labor force participation rate among population between the ages 35 and 44 in the United States with a correlation coefficient (R) of -0.117 and weighted average of 84.2%. Similarly, the statistical analysis conducted on geographies consisting of 158,722,541 people shows no correlation between the proportion of Immigrants from Bolivia and labor force participation rate among population between the ages 35 and 44 in the United States with a correlation coefficient (R) of -0.017 and weighted average of 86.2%, a difference of 2.5%.
In Labor Force | Age 35-44 Correlation Summary
| Measurement | Immigrants from North America | Immigrants from Bolivia |
| Minimum | 20.7% | 70.1% |
| Maximum | 100.0% | 100.0% |
| Range | 79.3% | 29.9% |
| Mean | 76.7% | 87.8% |
| Median | 83.6% | 87.5% |
| Interquartile 25% (IQ1) | 70.8% | 84.7% |
| Interquartile 75% (IQ3) | 86.8% | 90.1% |
| Interquartile Range (IQR) | 16.0% | 5.4% |
| Standard Deviation (Sample) | 21.5% | 5.3% |
| Standard Deviation (Population) | 21.2% | 5.3% |
Similar Demographics by In Labor Force | Age 35-44
Demographics Similar to Immigrants from North America by In Labor Force | Age 35-44
In terms of in labor force | age 35-44, the demographic groups most similar to Immigrants from North America are Immigrants from Costa Rica (84.2%, a difference of 0.010%), Laotian (84.2%, a difference of 0.010%), Swiss (84.2%, a difference of 0.010%), Canadian (84.2%, a difference of 0.020%), and Immigrants from Canada (84.2%, a difference of 0.020%).
| Demographics | Rating | Rank | In Labor Force | Age 35-44 |
| British | 23.0 /100 | #201 | Fair 84.2% |
| Immigrants | Uzbekistan | 22.8 /100 | #202 | Fair 84.2% |
| Immigrants | South Eastern Asia | 22.4 /100 | #203 | Fair 84.2% |
| Canadians | 19.9 /100 | #204 | Poor 84.2% |
| Immigrants | Canada | 19.6 /100 | #205 | Poor 84.2% |
| Immigrants | Costa Rica | 19.5 /100 | #206 | Poor 84.2% |
| Laotians | 19.0 /100 | #207 | Poor 84.2% |
| Immigrants | North America | 18.1 /100 | #208 | Poor 84.2% |
| Swiss | 17.4 /100 | #209 | Poor 84.2% |
| New Zealanders | 16.2 /100 | #210 | Poor 84.1% |
| Immigrants | Ecuador | 15.2 /100 | #211 | Poor 84.1% |
| Israelis | 14.0 /100 | #212 | Poor 84.1% |
| Bangladeshis | 13.7 /100 | #213 | Poor 84.1% |
| Immigrants | Barbados | 13.2 /100 | #214 | Poor 84.1% |
| Europeans | 12.2 /100 | #215 | Poor 84.1% |
Demographics Similar to Immigrants from Bolivia by In Labor Force | Age 35-44
In terms of in labor force | age 35-44, the demographic groups most similar to Immigrants from Bolivia are Immigrants from Cabo Verde (86.2%, a difference of 0.030%), Zimbabwean (86.1%, a difference of 0.16%), Bolivian (86.1%, a difference of 0.17%), Luxembourger (86.4%, a difference of 0.19%), and Sierra Leonean (86.4%, a difference of 0.21%).
| Demographics | Rating | Rank | In Labor Force | Age 35-44 |
| Sierra Leoneans | 100.0 /100 | #1 | Exceptional 86.4% |
| Luxembourgers | 100.0 /100 | #2 | Exceptional 86.4% |
| Immigrants | Bolivia | 100.0 /100 | #3 | Exceptional 86.2% |
| Immigrants | Cabo Verde | 100.0 /100 | #4 | Exceptional 86.2% |
| Zimbabweans | 100.0 /100 | #5 | Exceptional 86.1% |
| Bolivians | 100.0 /100 | #6 | Exceptional 86.1% |
| Immigrants | Sierra Leone | 100.0 /100 | #7 | Exceptional 86.1% |
| Immigrants | Ethiopia | 100.0 /100 | #8 | Exceptional 85.9% |
| Ethiopians | 100.0 /100 | #9 | Exceptional 85.9% |
| Cape Verdeans | 100.0 /100 | #10 | Exceptional 85.8% |
| Immigrants | Cameroon | 100.0 /100 | #11 | Exceptional 85.8% |
| Liberians | 100.0 /100 | #12 | Exceptional 85.7% |
| Somalis | 100.0 /100 | #13 | Exceptional 85.6% |
| Immigrants | Somalia | 100.0 /100 | #14 | Exceptional 85.6% |
| Norwegians | 100.0 /100 | #15 | Exceptional 85.6% |