Immigrants from North America vs Immigrants from Bolivia Unemployment Among Ages 65 to 74 years
COMPARE
Immigrants from North America
Immigrants from Bolivia
Unemployment Among Ages 65 to 74 years
Unemployment Among Ages 65 to 74 years Comparison
Immigrants from North America
Immigrants from Bolivia
5.3%
UNEMPLOYMENT AMONG AGES 65 TO 74 YEARS
86.7/ 100
METRIC RATING
127th/ 347
METRIC RANK
5.2%
UNEMPLOYMENT AMONG AGES 65 TO 74 YEARS
93.6/ 100
METRIC RATING
110th/ 347
METRIC RANK
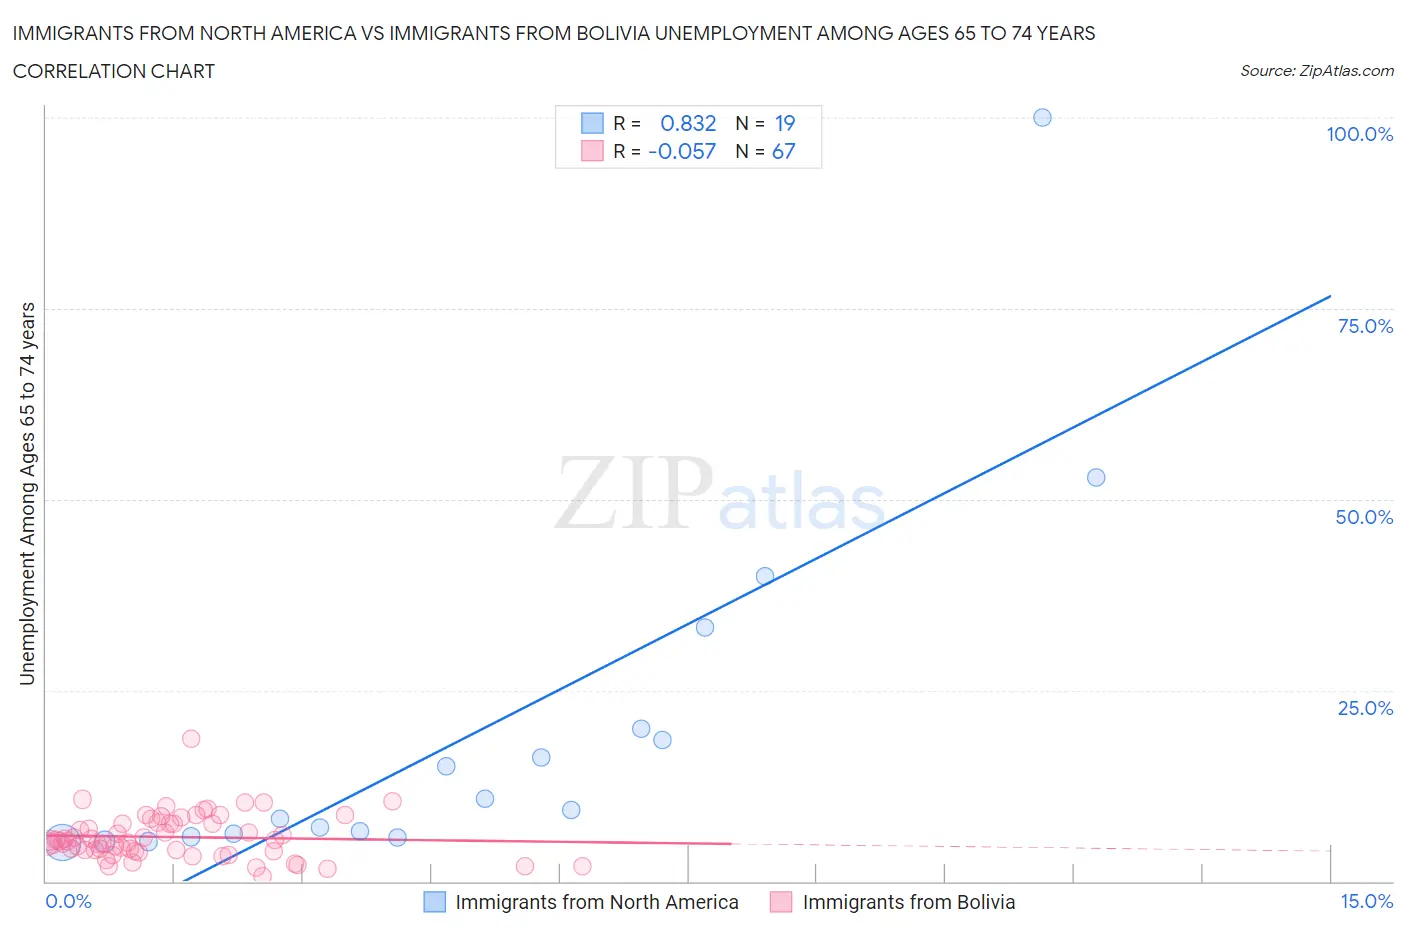
Immigrants from North America vs Immigrants from Bolivia Unemployment Among Ages 65 to 74 years Correlation Chart
The statistical analysis conducted on geographies consisting of 393,253,600 people shows a very strong positive correlation between the proportion of Immigrants from North America and unemployment rate among population between the ages 65 and 74 in the United States with a correlation coefficient (R) of 0.832 and weighted average of 5.3%. Similarly, the statistical analysis conducted on geographies consisting of 150,455,736 people shows a slight negative correlation between the proportion of Immigrants from Bolivia and unemployment rate among population between the ages 65 and 74 in the United States with a correlation coefficient (R) of -0.057 and weighted average of 5.2%, a difference of 0.68%.
Unemployment Among Ages 65 to 74 years Correlation Summary
| Measurement | Immigrants from North America | Immigrants from Bolivia |
| Minimum | 5.1% | 0.70% |
| Maximum | 100.0% | 18.6% |
| Range | 94.9% | 17.9% |
| Mean | 19.5% | 5.8% |
| Median | 9.3% | 5.2% |
| Interquartile 25% (IQ1) | 5.8% | 4.0% |
| Interquartile 75% (IQ3) | 20.0% | 7.5% |
| Interquartile Range (IQR) | 14.2% | 3.6% |
| Standard Deviation (Sample) | 23.6% | 2.9% |
| Standard Deviation (Population) | 23.0% | 2.9% |
Demographics Similar to Immigrants from North America and Immigrants from Bolivia by Unemployment Among Ages 65 to 74 years
In terms of unemployment among ages 65 to 74 years, the demographic groups most similar to Immigrants from North America are Immigrants from Hong Kong (5.3%, a difference of 0.010%), Immigrants from South Eastern Asia (5.3%, a difference of 0.040%), Pakistani (5.3%, a difference of 0.060%), Immigrants from Ukraine (5.3%, a difference of 0.070%), and Czechoslovakian (5.3%, a difference of 0.15%). Similarly, the demographic groups most similar to Immigrants from Bolivia are Immigrants from Singapore (5.2%, a difference of 0.050%), Immigrants from Malaysia (5.2%, a difference of 0.080%), Sri Lankan (5.3%, a difference of 0.11%), Immigrants from South Central Asia (5.3%, a difference of 0.16%), and Immigrants from Germany (5.3%, a difference of 0.25%).
| Demographics | Rating | Rank | Unemployment Among Ages 65 to 74 years |
| Immigrants | Malaysia | 94.1 /100 | #108 | Exceptional 5.2% |
| Immigrants | Singapore | 93.9 /100 | #109 | Exceptional 5.2% |
| Immigrants | Bolivia | 93.6 /100 | #110 | Exceptional 5.2% |
| Sri Lankans | 92.7 /100 | #111 | Exceptional 5.3% |
| Immigrants | South Central Asia | 92.4 /100 | #112 | Exceptional 5.3% |
| Immigrants | Germany | 91.6 /100 | #113 | Exceptional 5.3% |
| Asians | 91.1 /100 | #114 | Exceptional 5.3% |
| Immigrants | Turkey | 90.8 /100 | #115 | Exceptional 5.3% |
| Australians | 90.4 /100 | #116 | Exceptional 5.3% |
| Immigrants | Korea | 90.2 /100 | #117 | Exceptional 5.3% |
| Immigrants | Belarus | 90.1 /100 | #118 | Exceptional 5.3% |
| Immigrants | Fiji | 89.9 /100 | #119 | Excellent 5.3% |
| Immigrants | Switzerland | 89.9 /100 | #120 | Excellent 5.3% |
| Immigrants | Australia | 89.1 /100 | #121 | Excellent 5.3% |
| Immigrants | Canada | 89.0 /100 | #122 | Excellent 5.3% |
| Czechoslovakians | 88.6 /100 | #123 | Excellent 5.3% |
| Immigrants | Ukraine | 87.5 /100 | #124 | Excellent 5.3% |
| Pakistanis | 87.5 /100 | #125 | Excellent 5.3% |
| Immigrants | South Eastern Asia | 87.2 /100 | #126 | Excellent 5.3% |
| Immigrants | North America | 86.7 /100 | #127 | Excellent 5.3% |
| Immigrants | Hong Kong | 86.5 /100 | #128 | Excellent 5.3% |