Immigrants from Korea vs Apache In Labor Force | Age 20-24
COMPARE
Immigrants from Korea
Apache
In Labor Force | Age 20-24
In Labor Force | Age 20-24 Comparison
Immigrants from Korea
Apache
73.1%
IN LABOR FORCE | AGE 20-24
0.1/ 100
METRIC RATING
287th/ 347
METRIC RANK
72.0%
IN LABOR FORCE | AGE 20-24
0.0/ 100
METRIC RATING
311th/ 347
METRIC RANK
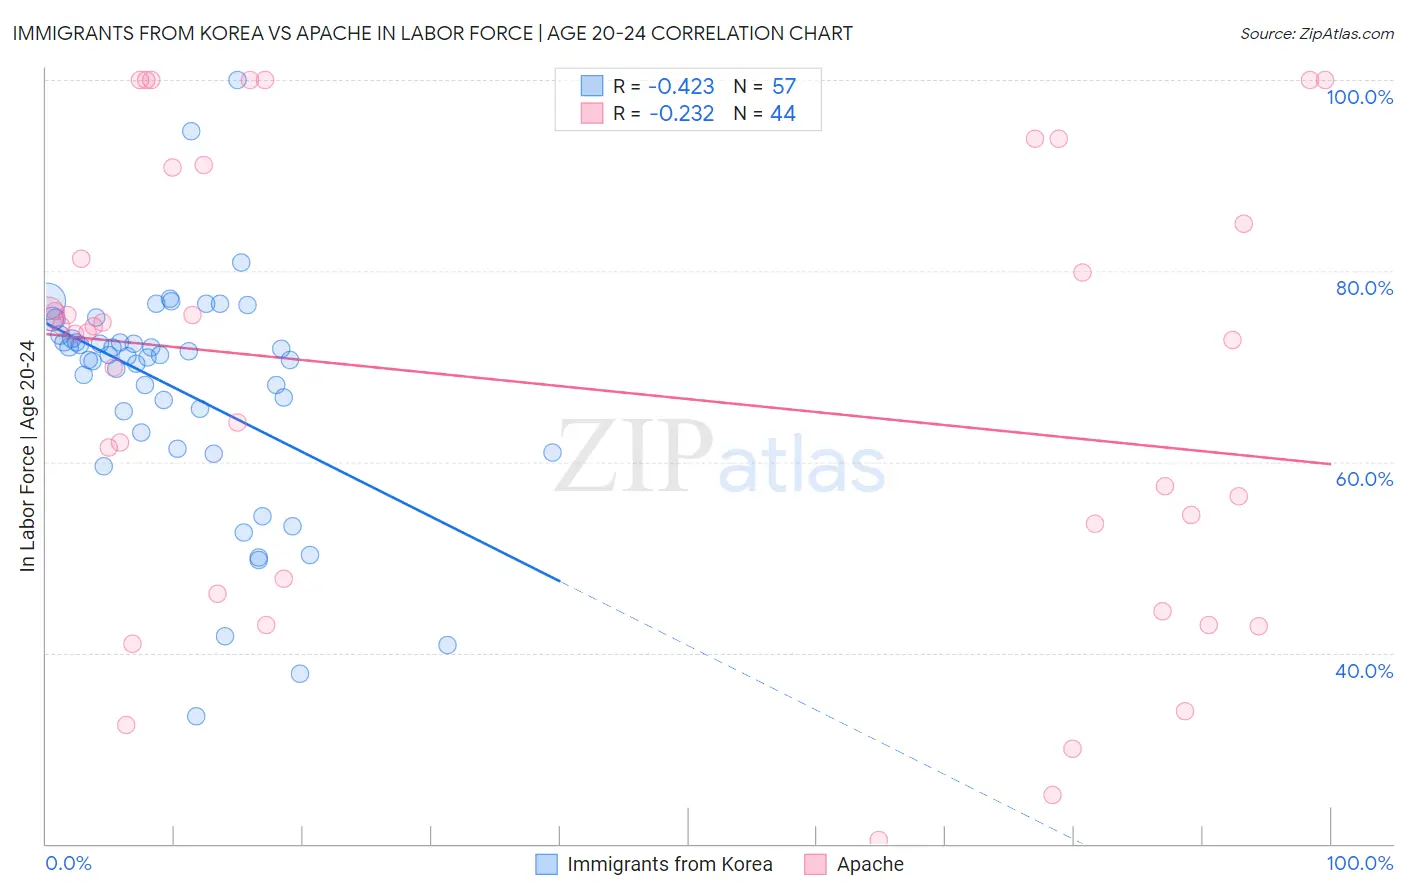
Immigrants from Korea vs Apache In Labor Force | Age 20-24 Correlation Chart
The statistical analysis conducted on geographies consisting of 416,204,507 people shows a moderate negative correlation between the proportion of Immigrants from Korea and labor force participation rate among population between the ages 20 and 24 in the United States with a correlation coefficient (R) of -0.423 and weighted average of 73.1%. Similarly, the statistical analysis conducted on geographies consisting of 231,058,831 people shows a weak negative correlation between the proportion of Apache and labor force participation rate among population between the ages 20 and 24 in the United States with a correlation coefficient (R) of -0.232 and weighted average of 72.0%, a difference of 1.6%.
In Labor Force | Age 20-24 Correlation Summary
| Measurement | Immigrants from Korea | Apache |
| Minimum | 33.3% | 20.4% |
| Maximum | 100.0% | 100.0% |
| Range | 66.7% | 79.6% |
| Mean | 67.6% | 67.9% |
| Median | 71.1% | 73.5% |
| Interquartile 25% (IQ1) | 62.2% | 47.0% |
| Interquartile 75% (IQ3) | 73.1% | 87.9% |
| Interquartile Range (IQR) | 10.8% | 40.9% |
| Standard Deviation (Sample) | 12.2% | 23.3% |
| Standard Deviation (Population) | 12.1% | 23.1% |
Similar Demographics by In Labor Force | Age 20-24
Demographics Similar to Immigrants from Korea by In Labor Force | Age 20-24
In terms of in labor force | age 20-24, the demographic groups most similar to Immigrants from Korea are Immigrants from Lebanon (73.1%, a difference of 0.020%), Nicaraguan (73.2%, a difference of 0.050%), Argentinean (73.1%, a difference of 0.080%), Kiowa (73.2%, a difference of 0.11%), and U.S. Virgin Islander (73.0%, a difference of 0.11%).
| Demographics | Rating | Rank | In Labor Force | Age 20-24 |
| Bahamians | 0.1 /100 | #280 | Tragic 73.3% |
| Immigrants | Venezuela | 0.1 /100 | #281 | Tragic 73.2% |
| Immigrants | Spain | 0.1 /100 | #282 | Tragic 73.2% |
| Immigrants | Bahamas | 0.1 /100 | #283 | Tragic 73.2% |
| Kiowa | 0.1 /100 | #284 | Tragic 73.2% |
| Nicaraguans | 0.1 /100 | #285 | Tragic 73.2% |
| Immigrants | Lebanon | 0.1 /100 | #286 | Tragic 73.1% |
| Immigrants | Korea | 0.1 /100 | #287 | Tragic 73.1% |
| Argentineans | 0.1 /100 | #288 | Tragic 73.1% |
| U.S. Virgin Islanders | 0.1 /100 | #289 | Tragic 73.0% |
| Immigrants | Belarus | 0.1 /100 | #290 | Tragic 73.0% |
| Immigrants | Nicaragua | 0.0 /100 | #291 | Tragic 72.9% |
| Pueblo | 0.0 /100 | #292 | Tragic 72.9% |
| Immigrants | Belize | 0.0 /100 | #293 | Tragic 72.8% |
| Immigrants | Argentina | 0.0 /100 | #294 | Tragic 72.8% |
Demographics Similar to Apache by In Labor Force | Age 20-24
In terms of in labor force | age 20-24, the demographic groups most similar to Apache are Immigrants from Cuba (72.0%, a difference of 0.010%), Immigrants from Caribbean (71.9%, a difference of 0.070%), Immigrants from Dominica (71.9%, a difference of 0.12%), Indian (Asian) (71.9%, a difference of 0.13%), and Immigrants from Iran (71.8%, a difference of 0.22%).
| Demographics | Rating | Rank | In Labor Force | Age 20-24 |
| Immigrants | West Indies | 0.0 /100 | #304 | Tragic 72.4% |
| Immigrants | Singapore | 0.0 /100 | #305 | Tragic 72.4% |
| Immigrants | Jamaica | 0.0 /100 | #306 | Tragic 72.4% |
| Immigrants | Ecuador | 0.0 /100 | #307 | Tragic 72.3% |
| Soviet Union | 0.0 /100 | #308 | Tragic 72.3% |
| Tsimshian | 0.0 /100 | #309 | Tragic 72.3% |
| Immigrants | Cuba | 0.0 /100 | #310 | Tragic 72.0% |
| Apache | 0.0 /100 | #311 | Tragic 72.0% |
| Immigrants | Caribbean | 0.0 /100 | #312 | Tragic 71.9% |
| Immigrants | Dominica | 0.0 /100 | #313 | Tragic 71.9% |
| Indians (Asian) | 0.0 /100 | #314 | Tragic 71.9% |
| Immigrants | Iran | 0.0 /100 | #315 | Tragic 71.8% |
| Immigrants | Eastern Asia | 0.0 /100 | #316 | Tragic 71.8% |
| Immigrants | Armenia | 0.0 /100 | #317 | Tragic 71.7% |
| Immigrants | Hong Kong | 0.0 /100 | #318 | Tragic 71.6% |