Immigrants from Uzbekistan vs Guamanian/Chamorro In Labor Force | Age 35-44
COMPARE
Immigrants from Uzbekistan
Guamanian/Chamorro
In Labor Force | Age 35-44
In Labor Force | Age 35-44 Comparison
Immigrants from Uzbekistan
Guamanians/Chamorros
84.2%
IN LABOR FORCE | AGE 35-44
22.8/ 100
METRIC RATING
202nd/ 347
METRIC RANK
83.4%
IN LABOR FORCE | AGE 35-44
0.1/ 100
METRIC RATING
267th/ 347
METRIC RANK
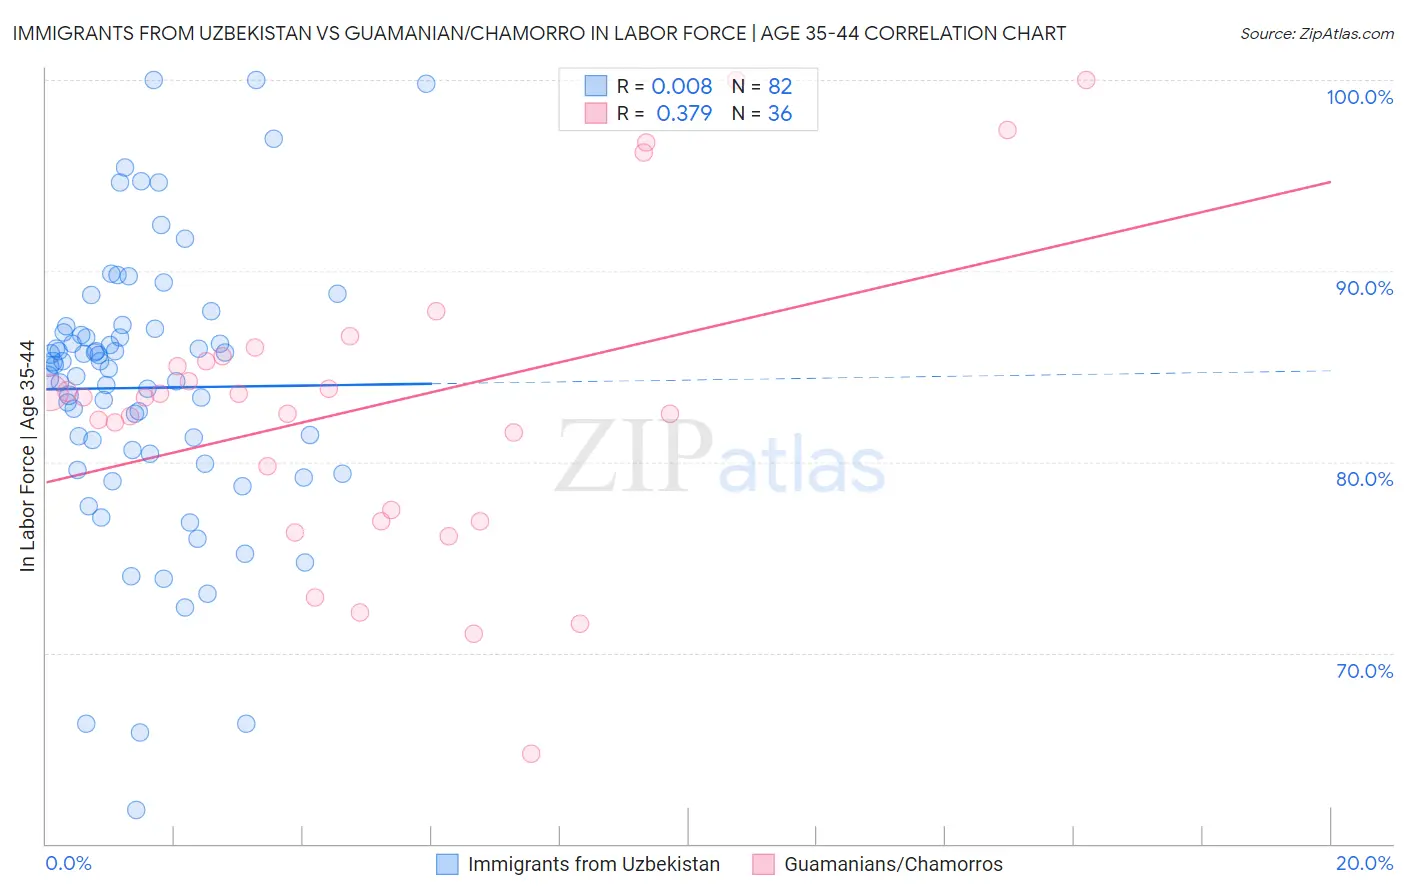
Immigrants from Uzbekistan vs Guamanian/Chamorro In Labor Force | Age 35-44 Correlation Chart
The statistical analysis conducted on geographies consisting of 118,733,606 people shows no correlation between the proportion of Immigrants from Uzbekistan and labor force participation rate among population between the ages 35 and 44 in the United States with a correlation coefficient (R) of 0.008 and weighted average of 84.2%. Similarly, the statistical analysis conducted on geographies consisting of 221,926,114 people shows a mild positive correlation between the proportion of Guamanians/Chamorros and labor force participation rate among population between the ages 35 and 44 in the United States with a correlation coefficient (R) of 0.379 and weighted average of 83.4%, a difference of 0.98%.
In Labor Force | Age 35-44 Correlation Summary
| Measurement | Immigrants from Uzbekistan | Guamanian/Chamorro |
| Minimum | 61.8% | 64.7% |
| Maximum | 100.0% | 100.0% |
| Range | 38.2% | 35.3% |
| Mean | 83.9% | 82.9% |
| Median | 85.0% | 83.4% |
| Interquartile 25% (IQ1) | 80.4% | 77.2% |
| Interquartile 75% (IQ3) | 86.8% | 85.4% |
| Interquartile Range (IQR) | 6.4% | 8.2% |
| Standard Deviation (Sample) | 7.3% | 8.0% |
| Standard Deviation (Population) | 7.2% | 7.9% |
Similar Demographics by In Labor Force | Age 35-44
Demographics Similar to Immigrants from Uzbekistan by In Labor Force | Age 35-44
In terms of in labor force | age 35-44, the demographic groups most similar to Immigrants from Uzbekistan are Syrian (84.2%, a difference of 0.0%), Moroccan (84.2%, a difference of 0.0%), British (84.2%, a difference of 0.0%), Immigrants from South Eastern Asia (84.2%, a difference of 0.0%), and Ecuadorian (84.2%, a difference of 0.010%).
| Demographics | Rating | Rank | In Labor Force | Age 35-44 |
| Immigrants | Caribbean | 25.7 /100 | #195 | Fair 84.2% |
| Immigrants | England | 25.0 /100 | #196 | Fair 84.2% |
| Immigrants | Western Europe | 24.7 /100 | #197 | Fair 84.2% |
| Ecuadorians | 24.0 /100 | #198 | Fair 84.2% |
| Syrians | 23.2 /100 | #199 | Fair 84.2% |
| Moroccans | 23.2 /100 | #200 | Fair 84.2% |
| British | 23.0 /100 | #201 | Fair 84.2% |
| Immigrants | Uzbekistan | 22.8 /100 | #202 | Fair 84.2% |
| Immigrants | South Eastern Asia | 22.4 /100 | #203 | Fair 84.2% |
| Canadians | 19.9 /100 | #204 | Poor 84.2% |
| Immigrants | Canada | 19.6 /100 | #205 | Poor 84.2% |
| Immigrants | Costa Rica | 19.5 /100 | #206 | Poor 84.2% |
| Laotians | 19.0 /100 | #207 | Poor 84.2% |
| Immigrants | North America | 18.1 /100 | #208 | Poor 84.2% |
| Swiss | 17.4 /100 | #209 | Poor 84.2% |
Demographics Similar to Guamanians/Chamorros by In Labor Force | Age 35-44
In terms of in labor force | age 35-44, the demographic groups most similar to Guamanians/Chamorros are Honduran (83.4%, a difference of 0.030%), Immigrants from Grenada (83.3%, a difference of 0.040%), Spaniard (83.4%, a difference of 0.050%), Central American (83.5%, a difference of 0.080%), and Scotch-Irish (83.5%, a difference of 0.090%).
| Demographics | Rating | Rank | In Labor Force | Age 35-44 |
| Vietnamese | 0.2 /100 | #260 | Tragic 83.5% |
| Immigrants | Dominica | 0.2 /100 | #261 | Tragic 83.5% |
| Immigrants | Congo | 0.2 /100 | #262 | Tragic 83.5% |
| Iroquois | 0.2 /100 | #263 | Tragic 83.5% |
| Scotch-Irish | 0.1 /100 | #264 | Tragic 83.5% |
| Central Americans | 0.1 /100 | #265 | Tragic 83.5% |
| Spaniards | 0.1 /100 | #266 | Tragic 83.4% |
| Guamanians/Chamorros | 0.1 /100 | #267 | Tragic 83.4% |
| Hondurans | 0.1 /100 | #268 | Tragic 83.4% |
| Immigrants | Grenada | 0.1 /100 | #269 | Tragic 83.3% |
| Immigrants | Honduras | 0.0 /100 | #270 | Tragic 83.3% |
| French American Indians | 0.0 /100 | #271 | Tragic 83.2% |
| Immigrants | Fiji | 0.0 /100 | #272 | Tragic 83.2% |
| Spanish | 0.0 /100 | #273 | Tragic 83.2% |
| Immigrants | Nonimmigrants | 0.0 /100 | #274 | Tragic 83.2% |