Immigrants from Nepal vs Mexican American Indian In Labor Force | Age 35-44
COMPARE
Immigrants from Nepal
Mexican American Indian
In Labor Force | Age 35-44
In Labor Force | Age 35-44 Comparison
Immigrants from Nepal
Mexican American Indians
85.3%
IN LABOR FORCE | AGE 35-44
99.9/ 100
METRIC RATING
34th/ 347
METRIC RANK
82.6%
IN LABOR FORCE | AGE 35-44
0.0/ 100
METRIC RATING
296th/ 347
METRIC RANK
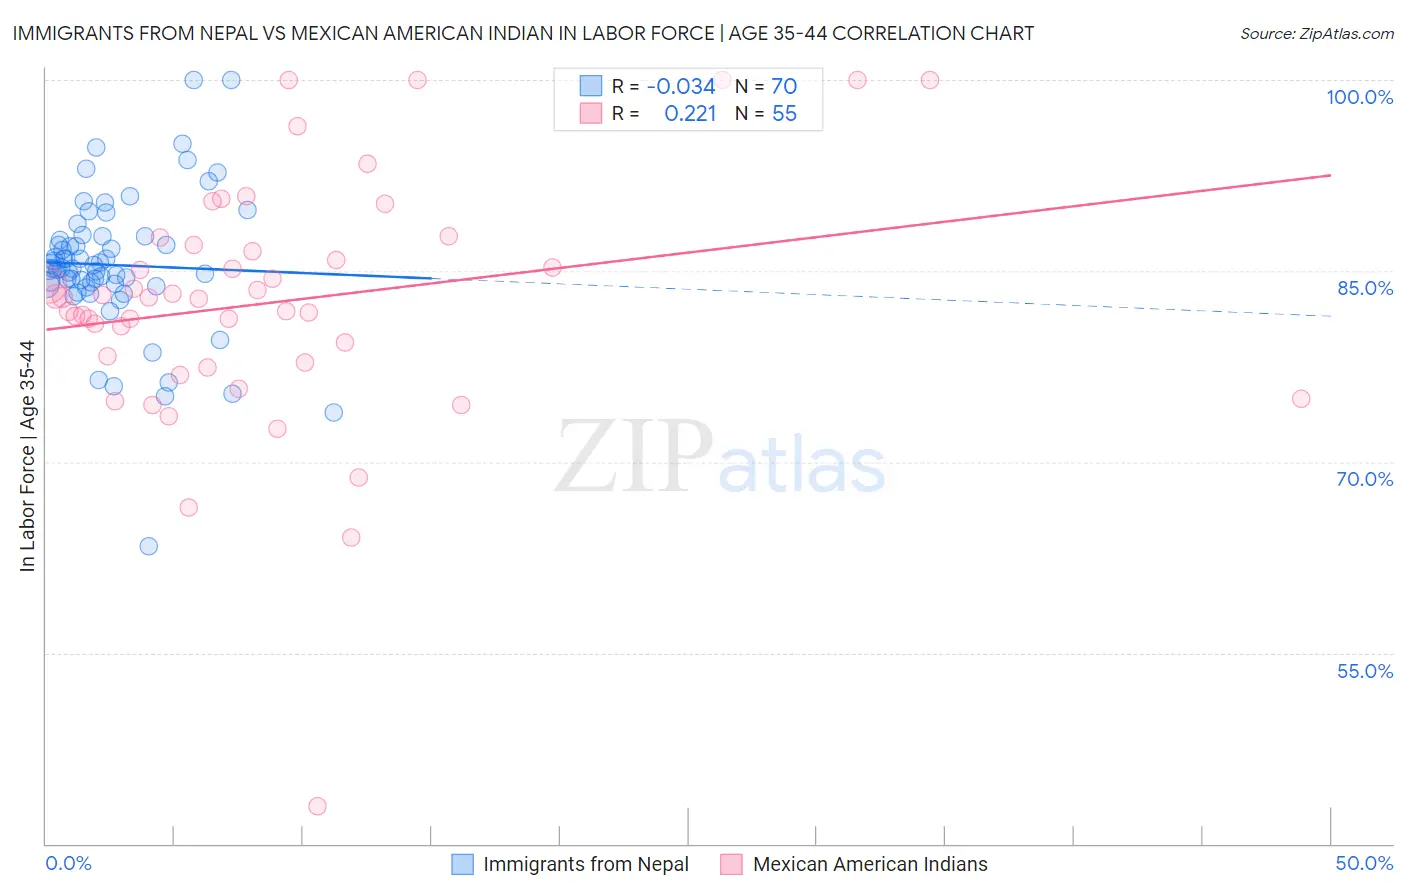
Immigrants from Nepal vs Mexican American Indian In Labor Force | Age 35-44 Correlation Chart
The statistical analysis conducted on geographies consisting of 186,726,251 people shows no correlation between the proportion of Immigrants from Nepal and labor force participation rate among population between the ages 35 and 44 in the United States with a correlation coefficient (R) of -0.034 and weighted average of 85.3%. Similarly, the statistical analysis conducted on geographies consisting of 317,545,912 people shows a weak positive correlation between the proportion of Mexican American Indians and labor force participation rate among population between the ages 35 and 44 in the United States with a correlation coefficient (R) of 0.221 and weighted average of 82.6%, a difference of 3.3%.
In Labor Force | Age 35-44 Correlation Summary
| Measurement | Immigrants from Nepal | Mexican American Indian |
| Minimum | 63.4% | 42.9% |
| Maximum | 100.0% | 100.0% |
| Range | 36.6% | 57.1% |
| Mean | 85.5% | 82.6% |
| Median | 85.2% | 82.9% |
| Interquartile 25% (IQ1) | 83.9% | 77.8% |
| Interquartile 75% (IQ3) | 87.7% | 87.0% |
| Interquartile Range (IQR) | 3.8% | 9.2% |
| Standard Deviation (Sample) | 5.7% | 9.8% |
| Standard Deviation (Population) | 5.6% | 9.7% |
Similar Demographics by In Labor Force | Age 35-44
Demographics Similar to Immigrants from Nepal by In Labor Force | Age 35-44
In terms of in labor force | age 35-44, the demographic groups most similar to Immigrants from Nepal are Estonian (85.3%, a difference of 0.0%), Ugandan (85.3%, a difference of 0.020%), Czech (85.3%, a difference of 0.030%), Immigrants from India (85.3%, a difference of 0.030%), and Immigrants from Morocco (85.2%, a difference of 0.030%).
| Demographics | Rating | Rank | In Labor Force | Age 35-44 |
| Immigrants | Lithuania | 99.9 /100 | #27 | Exceptional 85.4% |
| Immigrants | Greece | 99.9 /100 | #28 | Exceptional 85.3% |
| Cambodians | 99.9 /100 | #29 | Exceptional 85.3% |
| Bermudans | 99.9 /100 | #30 | Exceptional 85.3% |
| Czechs | 99.9 /100 | #31 | Exceptional 85.3% |
| Immigrants | India | 99.9 /100 | #32 | Exceptional 85.3% |
| Ugandans | 99.9 /100 | #33 | Exceptional 85.3% |
| Immigrants | Nepal | 99.9 /100 | #34 | Exceptional 85.3% |
| Estonians | 99.9 /100 | #35 | Exceptional 85.3% |
| Immigrants | Morocco | 99.8 /100 | #36 | Exceptional 85.2% |
| Kenyans | 99.8 /100 | #37 | Exceptional 85.2% |
| Immigrants | Poland | 99.8 /100 | #38 | Exceptional 85.2% |
| Eastern Europeans | 99.8 /100 | #39 | Exceptional 85.2% |
| Immigrants | Bulgaria | 99.8 /100 | #40 | Exceptional 85.2% |
| Immigrants | Zimbabwe | 99.8 /100 | #41 | Exceptional 85.2% |
Demographics Similar to Mexican American Indians by In Labor Force | Age 35-44
In terms of in labor force | age 35-44, the demographic groups most similar to Mexican American Indians are Hmong (82.6%, a difference of 0.010%), Ottawa (82.6%, a difference of 0.020%), Tlingit-Haida (82.5%, a difference of 0.040%), Immigrants from Lebanon (82.7%, a difference of 0.10%), and Central American Indian (82.5%, a difference of 0.10%).
| Demographics | Rating | Rank | In Labor Force | Age 35-44 |
| Chippewa | 0.0 /100 | #289 | Tragic 82.9% |
| Africans | 0.0 /100 | #290 | Tragic 82.9% |
| Pennsylvania Germans | 0.0 /100 | #291 | Tragic 82.9% |
| Immigrants | Latin America | 0.0 /100 | #292 | Tragic 82.8% |
| Spanish Americans | 0.0 /100 | #293 | Tragic 82.8% |
| Potawatomi | 0.0 /100 | #294 | Tragic 82.7% |
| Immigrants | Lebanon | 0.0 /100 | #295 | Tragic 82.7% |
| Mexican American Indians | 0.0 /100 | #296 | Tragic 82.6% |
| Hmong | 0.0 /100 | #297 | Tragic 82.6% |
| Ottawa | 0.0 /100 | #298 | Tragic 82.6% |
| Tlingit-Haida | 0.0 /100 | #299 | Tragic 82.5% |
| Central American Indians | 0.0 /100 | #300 | Tragic 82.5% |
| Spanish American Indians | 0.0 /100 | #301 | Tragic 82.5% |
| Americans | 0.0 /100 | #302 | Tragic 82.4% |
| Nepalese | 0.0 /100 | #303 | Tragic 82.4% |