Somali vs Hispanic or Latino In Labor Force | Age 16-19
COMPARE
Somali
Hispanic or Latino
In Labor Force | Age 16-19
In Labor Force | Age 16-19 Comparison
Somalis
Hispanics or Latinos
45.1%
IN LABOR FORCE | AGE 16-19
100.0/ 100
METRIC RATING
6th/ 347
METRIC RANK
34.5%
IN LABOR FORCE | AGE 16-19
1.1/ 100
METRIC RATING
262nd/ 347
METRIC RANK
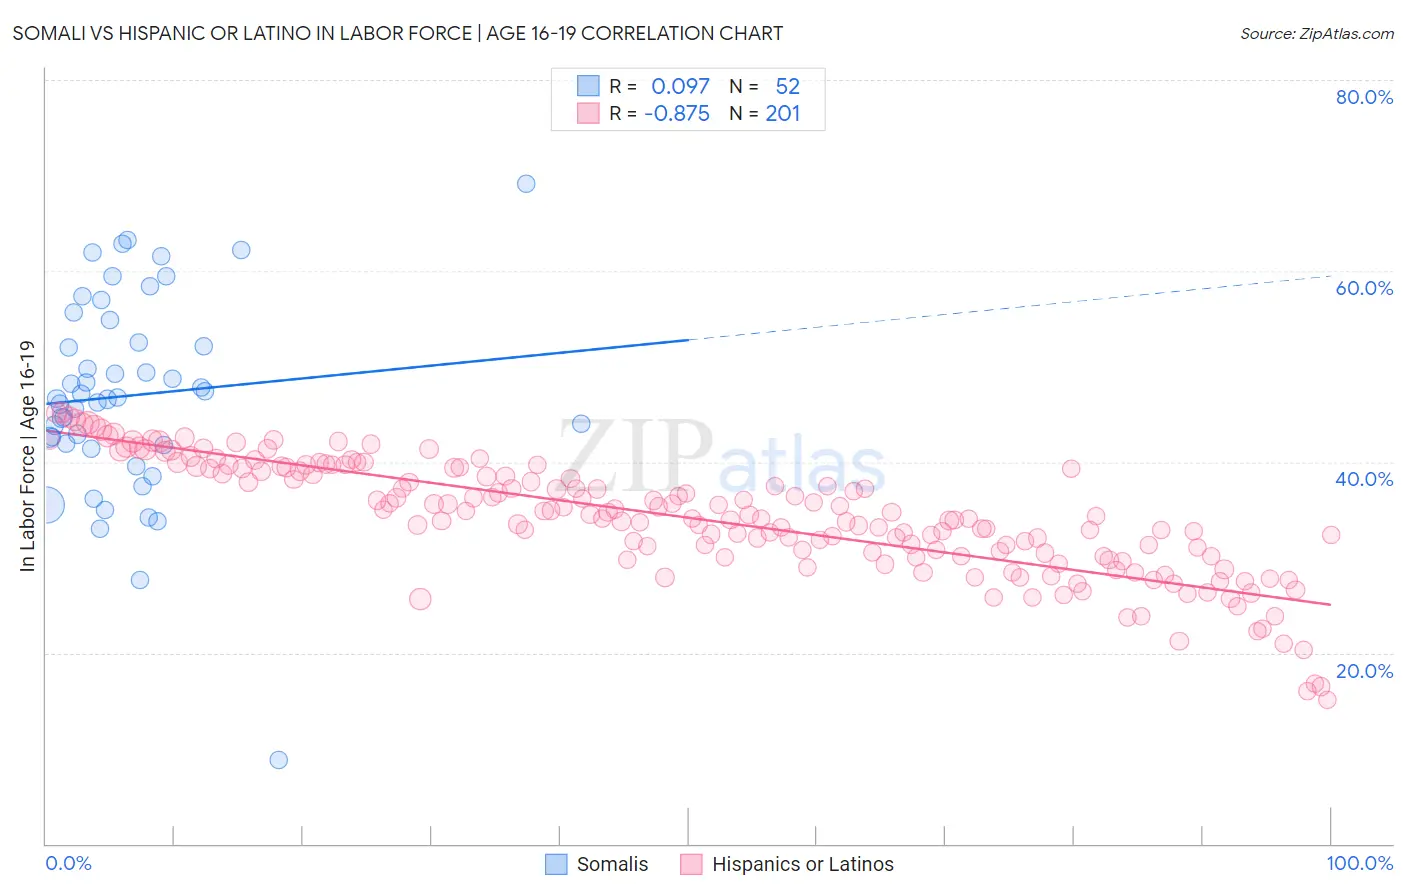
Somali vs Hispanic or Latino In Labor Force | Age 16-19 Correlation Chart
The statistical analysis conducted on geographies consisting of 99,321,007 people shows a slight positive correlation between the proportion of Somalis and labor force participation rate among population between the ages 16 and 19 in the United States with a correlation coefficient (R) of 0.097 and weighted average of 45.1%. Similarly, the statistical analysis conducted on geographies consisting of 573,733,594 people shows a very strong negative correlation between the proportion of Hispanics or Latinos and labor force participation rate among population between the ages 16 and 19 in the United States with a correlation coefficient (R) of -0.875 and weighted average of 34.5%, a difference of 30.8%.
In Labor Force | Age 16-19 Correlation Summary
| Measurement | Somali | Hispanic or Latino |
| Minimum | 8.8% | 15.0% |
| Maximum | 69.1% | 45.2% |
| Range | 60.3% | 30.2% |
| Mean | 47.0% | 34.1% |
| Median | 46.7% | 34.3% |
| Interquartile 25% (IQ1) | 41.8% | 30.2% |
| Interquartile 75% (IQ3) | 53.7% | 39.3% |
| Interquartile Range (IQR) | 11.8% | 9.1% |
| Standard Deviation (Sample) | 10.6% | 6.1% |
| Standard Deviation (Population) | 10.5% | 6.1% |
Similar Demographics by In Labor Force | Age 16-19
Demographics Similar to Somalis by In Labor Force | Age 16-19
In terms of in labor force | age 16-19, the demographic groups most similar to Somalis are Alaskan Athabascan (45.2%, a difference of 0.17%), Luxembourger (45.3%, a difference of 0.36%), Danish (44.7%, a difference of 0.95%), Immigrants from Cabo Verde (44.7%, a difference of 0.99%), and Immigrants from Somalia (45.6%, a difference of 1.0%).
| Demographics | Rating | Rank | In Labor Force | Age 16-19 |
| Pennsylvania Germans | 100.0 /100 | #1 | Exceptional 46.4% |
| Norwegians | 100.0 /100 | #2 | Exceptional 46.2% |
| Immigrants | Somalia | 100.0 /100 | #3 | Exceptional 45.6% |
| Luxembourgers | 100.0 /100 | #4 | Exceptional 45.3% |
| Alaskan Athabascans | 100.0 /100 | #5 | Exceptional 45.2% |
| Somalis | 100.0 /100 | #6 | Exceptional 45.1% |
| Danes | 100.0 /100 | #7 | Exceptional 44.7% |
| Immigrants | Cabo Verde | 100.0 /100 | #8 | Exceptional 44.7% |
| Cape Verdeans | 100.0 /100 | #9 | Exceptional 44.5% |
| Germans | 100.0 /100 | #10 | Exceptional 44.2% |
| Swedes | 100.0 /100 | #11 | Exceptional 44.1% |
| Finns | 100.0 /100 | #12 | Exceptional 43.9% |
| Dutch | 100.0 /100 | #13 | Exceptional 43.8% |
| Chippewa | 100.0 /100 | #14 | Exceptional 43.8% |
| Slovenes | 100.0 /100 | #15 | Exceptional 43.7% |
Demographics Similar to Hispanics or Latinos by In Labor Force | Age 16-19
In terms of in labor force | age 16-19, the demographic groups most similar to Hispanics or Latinos are Salvadoran (34.5%, a difference of 0.010%), Burmese (34.5%, a difference of 0.040%), Egyptian (34.5%, a difference of 0.050%), Immigrants (34.6%, a difference of 0.13%), and Immigrants from Egypt (34.6%, a difference of 0.15%).
| Demographics | Rating | Rank | In Labor Force | Age 16-19 |
| Peruvians | 1.4 /100 | #255 | Tragic 34.6% |
| Immigrants | South Central Asia | 1.3 /100 | #256 | Tragic 34.6% |
| Immigrants | Egypt | 1.2 /100 | #257 | Tragic 34.6% |
| Thais | 1.2 /100 | #258 | Tragic 34.6% |
| Immigrants | Immigrants | 1.2 /100 | #259 | Tragic 34.6% |
| Egyptians | 1.2 /100 | #260 | Tragic 34.5% |
| Salvadorans | 1.1 /100 | #261 | Tragic 34.5% |
| Hispanics or Latinos | 1.1 /100 | #262 | Tragic 34.5% |
| Burmese | 1.1 /100 | #263 | Tragic 34.5% |
| Immigrants | Uruguay | 0.9 /100 | #264 | Tragic 34.4% |
| Immigrants | El Salvador | 0.7 /100 | #265 | Tragic 34.3% |
| Immigrants | Malaysia | 0.7 /100 | #266 | Tragic 34.3% |
| Immigrants | Peru | 0.5 /100 | #267 | Tragic 34.2% |
| Immigrants | Asia | 0.5 /100 | #268 | Tragic 34.1% |
| Pima | 0.5 /100 | #269 | Tragic 34.1% |