Immigrants from Croatia vs Hispanic or Latino In Labor Force | Age 16-19
COMPARE
Immigrants from Croatia
Hispanic or Latino
In Labor Force | Age 16-19
In Labor Force | Age 16-19 Comparison
Immigrants from Croatia
Hispanics or Latinos
36.1%
IN LABOR FORCE | AGE 16-19
27.5/ 100
METRIC RATING
191st/ 347
METRIC RANK
34.5%
IN LABOR FORCE | AGE 16-19
1.1/ 100
METRIC RATING
262nd/ 347
METRIC RANK
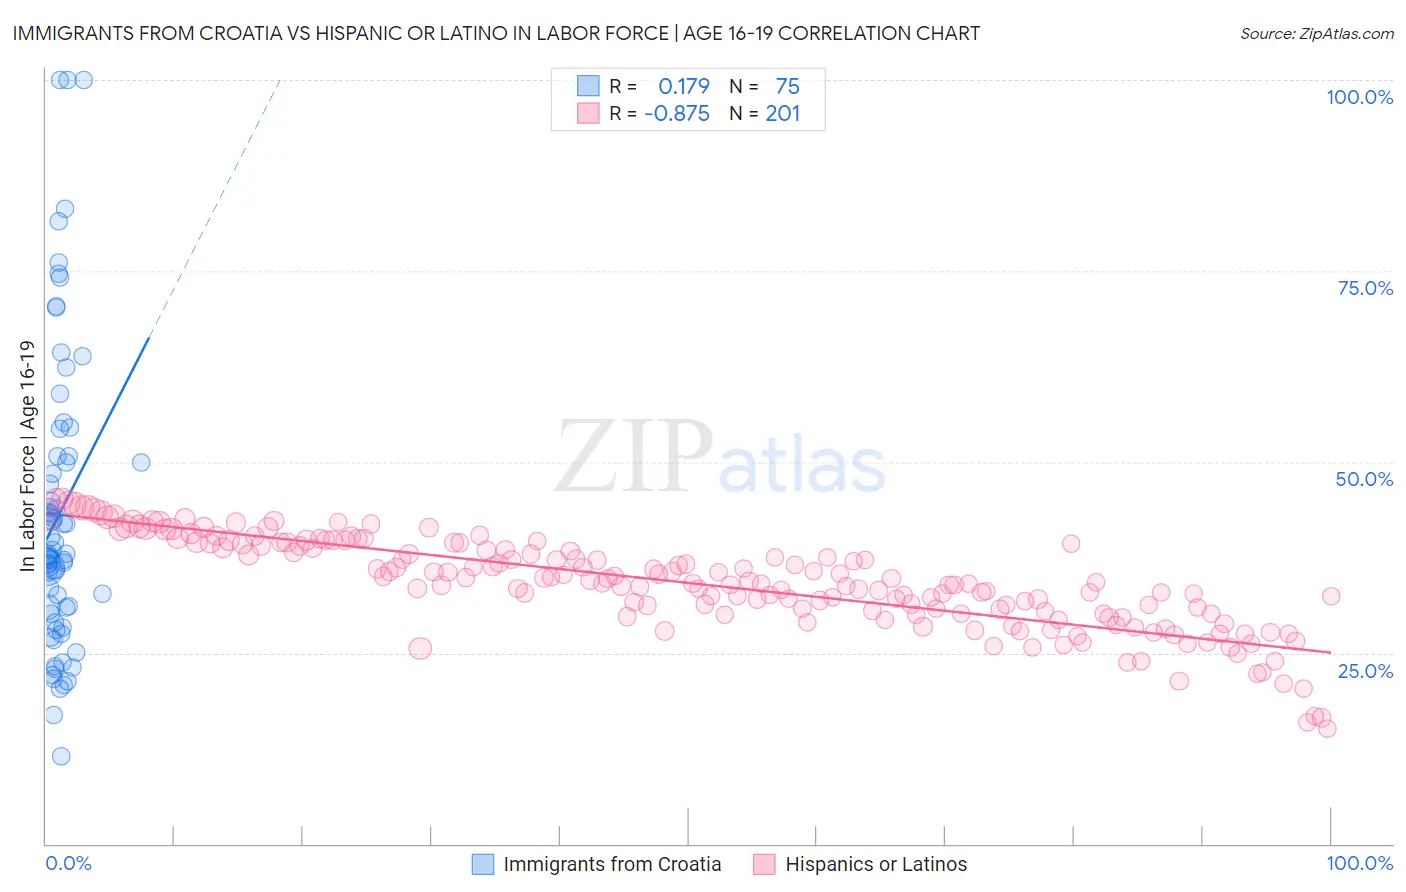
Immigrants from Croatia vs Hispanic or Latino In Labor Force | Age 16-19 Correlation Chart
The statistical analysis conducted on geographies consisting of 132,497,839 people shows a poor positive correlation between the proportion of Immigrants from Croatia and labor force participation rate among population between the ages 16 and 19 in the United States with a correlation coefficient (R) of 0.179 and weighted average of 36.1%. Similarly, the statistical analysis conducted on geographies consisting of 573,733,594 people shows a very strong negative correlation between the proportion of Hispanics or Latinos and labor force participation rate among population between the ages 16 and 19 in the United States with a correlation coefficient (R) of -0.875 and weighted average of 34.5%, a difference of 4.7%.
In Labor Force | Age 16-19 Correlation Summary
| Measurement | Immigrants from Croatia | Hispanic or Latino |
| Minimum | 11.5% | 15.0% |
| Maximum | 100.0% | 45.2% |
| Range | 88.5% | 30.2% |
| Mean | 43.3% | 34.1% |
| Median | 37.8% | 34.3% |
| Interquartile 25% (IQ1) | 30.1% | 30.2% |
| Interquartile 75% (IQ3) | 50.7% | 39.3% |
| Interquartile Range (IQR) | 20.6% | 9.1% |
| Standard Deviation (Sample) | 19.6% | 6.1% |
| Standard Deviation (Population) | 19.5% | 6.1% |
Similar Demographics by In Labor Force | Age 16-19
Demographics Similar to Immigrants from Croatia by In Labor Force | Age 16-19
In terms of in labor force | age 16-19, the demographic groups most similar to Immigrants from Croatia are Panamanian (36.1%, a difference of 0.070%), Immigrants from Hungary (36.2%, a difference of 0.080%), Afghan (36.1%, a difference of 0.12%), Immigrants from Denmark (36.1%, a difference of 0.17%), and Nigerian (36.1%, a difference of 0.19%).
| Demographics | Rating | Rank | In Labor Force | Age 16-19 |
| Costa Ricans | 36.1 /100 | #184 | Fair 36.3% |
| Bhutanese | 35.3 /100 | #185 | Fair 36.3% |
| Immigrants | Romania | 34.0 /100 | #186 | Fair 36.3% |
| Immigrants | Afghanistan | 34.0 /100 | #187 | Fair 36.3% |
| Immigrants | Europe | 31.8 /100 | #188 | Fair 36.2% |
| Immigrants | Hungary | 28.8 /100 | #189 | Fair 36.2% |
| Panamanians | 28.6 /100 | #190 | Fair 36.1% |
| Immigrants | Croatia | 27.5 /100 | #191 | Fair 36.1% |
| Afghans | 25.7 /100 | #192 | Fair 36.1% |
| Immigrants | Denmark | 25.0 /100 | #193 | Fair 36.1% |
| Nigerians | 24.6 /100 | #194 | Fair 36.1% |
| Bolivians | 23.3 /100 | #195 | Fair 36.0% |
| Mexican American Indians | 21.1 /100 | #196 | Fair 36.0% |
| Immigrants | Serbia | 21.0 /100 | #197 | Fair 36.0% |
| Immigrants | Northern Africa | 19.9 /100 | #198 | Poor 35.9% |
Demographics Similar to Hispanics or Latinos by In Labor Force | Age 16-19
In terms of in labor force | age 16-19, the demographic groups most similar to Hispanics or Latinos are Salvadoran (34.5%, a difference of 0.010%), Burmese (34.5%, a difference of 0.040%), Egyptian (34.5%, a difference of 0.050%), Immigrants (34.6%, a difference of 0.13%), and Immigrants from Egypt (34.6%, a difference of 0.15%).
| Demographics | Rating | Rank | In Labor Force | Age 16-19 |
| Peruvians | 1.4 /100 | #255 | Tragic 34.6% |
| Immigrants | South Central Asia | 1.3 /100 | #256 | Tragic 34.6% |
| Immigrants | Egypt | 1.2 /100 | #257 | Tragic 34.6% |
| Thais | 1.2 /100 | #258 | Tragic 34.6% |
| Immigrants | Immigrants | 1.2 /100 | #259 | Tragic 34.6% |
| Egyptians | 1.2 /100 | #260 | Tragic 34.5% |
| Salvadorans | 1.1 /100 | #261 | Tragic 34.5% |
| Hispanics or Latinos | 1.1 /100 | #262 | Tragic 34.5% |
| Burmese | 1.1 /100 | #263 | Tragic 34.5% |
| Immigrants | Uruguay | 0.9 /100 | #264 | Tragic 34.4% |
| Immigrants | El Salvador | 0.7 /100 | #265 | Tragic 34.3% |
| Immigrants | Malaysia | 0.7 /100 | #266 | Tragic 34.3% |
| Immigrants | Peru | 0.5 /100 | #267 | Tragic 34.2% |
| Immigrants | Asia | 0.5 /100 | #268 | Tragic 34.1% |
| Pima | 0.5 /100 | #269 | Tragic 34.1% |