Immigrants from Morocco vs Bermudan In Labor Force | Age 45-54
COMPARE
Immigrants from Morocco
Bermudan
In Labor Force | Age 45-54
In Labor Force | Age 45-54 Comparison
Immigrants from Morocco
Bermudans
83.6%
IN LABOR FORCE | AGE 45-54
99.0/ 100
METRIC RATING
49th/ 347
METRIC RANK
83.1%
IN LABOR FORCE | AGE 45-54
88.0/ 100
METRIC RATING
124th/ 347
METRIC RANK
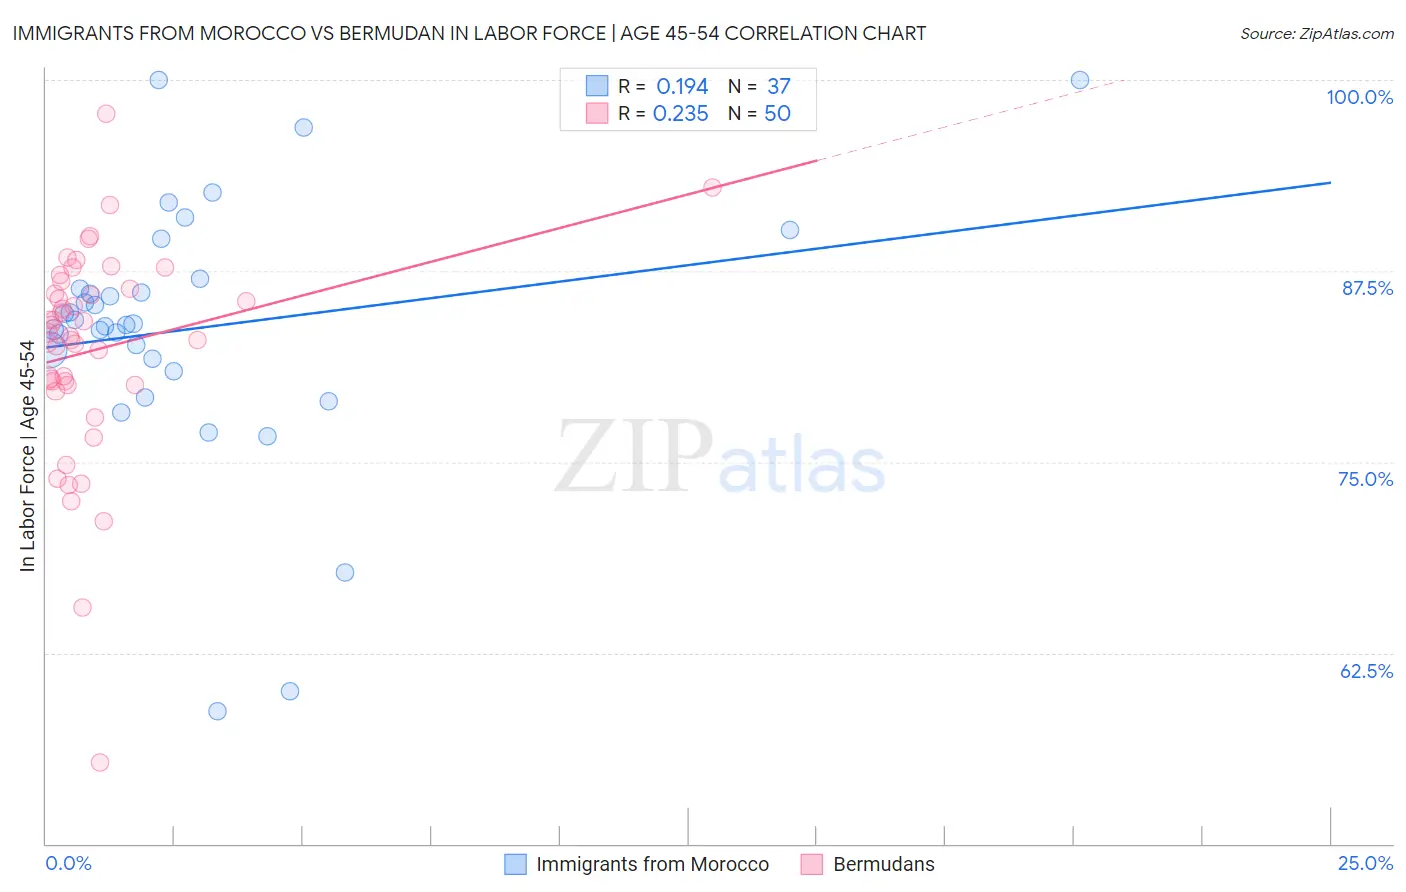
Immigrants from Morocco vs Bermudan In Labor Force | Age 45-54 Correlation Chart
The statistical analysis conducted on geographies consisting of 178,909,930 people shows a poor positive correlation between the proportion of Immigrants from Morocco and labor force participation rate among population between the ages 45 and 54 in the United States with a correlation coefficient (R) of 0.194 and weighted average of 83.6%. Similarly, the statistical analysis conducted on geographies consisting of 55,715,223 people shows a weak positive correlation between the proportion of Bermudans and labor force participation rate among population between the ages 45 and 54 in the United States with a correlation coefficient (R) of 0.235 and weighted average of 83.1%, a difference of 0.56%.
In Labor Force | Age 45-54 Correlation Summary
| Measurement | Immigrants from Morocco | Bermudan |
| Minimum | 58.7% | 55.3% |
| Maximum | 100.0% | 97.8% |
| Range | 41.3% | 42.5% |
| Mean | 83.7% | 82.3% |
| Median | 84.0% | 83.3% |
| Interquartile 25% (IQ1) | 81.3% | 80.0% |
| Interquartile 75% (IQ3) | 86.7% | 86.3% |
| Interquartile Range (IQR) | 5.4% | 6.3% |
| Standard Deviation (Sample) | 8.6% | 7.1% |
| Standard Deviation (Population) | 8.5% | 7.0% |
Similar Demographics by In Labor Force | Age 45-54
Demographics Similar to Immigrants from Morocco by In Labor Force | Age 45-54
In terms of in labor force | age 45-54, the demographic groups most similar to Immigrants from Morocco are Immigrants from Poland (83.6%, a difference of 0.0%), Croatian (83.6%, a difference of 0.010%), Lithuanian (83.6%, a difference of 0.020%), Burmese (83.6%, a difference of 0.030%), and Immigrants from Hong Kong (83.6%, a difference of 0.030%).
| Demographics | Rating | Rank | In Labor Force | Age 45-54 |
| Immigrants | Moldova | 99.3 /100 | #42 | Exceptional 83.7% |
| Venezuelans | 99.2 /100 | #43 | Exceptional 83.6% |
| Burmese | 99.1 /100 | #44 | Exceptional 83.6% |
| Immigrants | Hong Kong | 99.1 /100 | #45 | Exceptional 83.6% |
| Lithuanians | 99.1 /100 | #46 | Exceptional 83.6% |
| Croatians | 99.0 /100 | #47 | Exceptional 83.6% |
| Immigrants | Poland | 99.0 /100 | #48 | Exceptional 83.6% |
| Immigrants | Morocco | 99.0 /100 | #49 | Exceptional 83.6% |
| Immigrants | Greece | 98.8 /100 | #50 | Exceptional 83.6% |
| Immigrants | Turkey | 98.8 /100 | #51 | Exceptional 83.6% |
| Poles | 98.7 /100 | #52 | Exceptional 83.6% |
| Peruvians | 98.7 /100 | #53 | Exceptional 83.6% |
| Somalis | 98.7 /100 | #54 | Exceptional 83.5% |
| Macedonians | 98.7 /100 | #55 | Exceptional 83.5% |
| Immigrants | Peru | 98.6 /100 | #56 | Exceptional 83.5% |
Demographics Similar to Bermudans by In Labor Force | Age 45-54
In terms of in labor force | age 45-54, the demographic groups most similar to Bermudans are Tongan (83.1%, a difference of 0.0%), Immigrants from Vietnam (83.1%, a difference of 0.020%), Immigrants from Iran (83.1%, a difference of 0.020%), Uruguayan (83.1%, a difference of 0.030%), and Immigrants from Belgium (83.1%, a difference of 0.030%).
| Demographics | Rating | Rank | In Labor Force | Age 45-54 |
| Immigrants | China | 90.9 /100 | #117 | Exceptional 83.2% |
| Immigrants | Europe | 90.7 /100 | #118 | Exceptional 83.2% |
| Immigrants | Uruguay | 90.2 /100 | #119 | Exceptional 83.2% |
| Immigrants | Russia | 90.1 /100 | #120 | Exceptional 83.2% |
| Uruguayans | 89.4 /100 | #121 | Excellent 83.1% |
| Immigrants | Vietnam | 88.9 /100 | #122 | Excellent 83.1% |
| Tongans | 88.2 /100 | #123 | Excellent 83.1% |
| Bermudans | 88.0 /100 | #124 | Excellent 83.1% |
| Immigrants | Iran | 87.2 /100 | #125 | Excellent 83.1% |
| Immigrants | Belgium | 86.4 /100 | #126 | Excellent 83.1% |
| Immigrants | Jordan | 85.2 /100 | #127 | Excellent 83.1% |
| Germans | 85.1 /100 | #128 | Excellent 83.1% |
| Immigrants | Northern Europe | 85.1 /100 | #129 | Excellent 83.1% |
| Immigrants | Israel | 84.7 /100 | #130 | Excellent 83.1% |
| Finns | 83.3 /100 | #131 | Excellent 83.1% |