Immigrants from Morocco vs Central American Indian In Labor Force | Age 45-54
COMPARE
Immigrants from Morocco
Central American Indian
In Labor Force | Age 45-54
In Labor Force | Age 45-54 Comparison
Immigrants from Morocco
Central American Indians
83.6%
IN LABOR FORCE | AGE 45-54
99.0/ 100
METRIC RATING
49th/ 347
METRIC RANK
80.0%
IN LABOR FORCE | AGE 45-54
0.0/ 100
METRIC RATING
308th/ 347
METRIC RANK
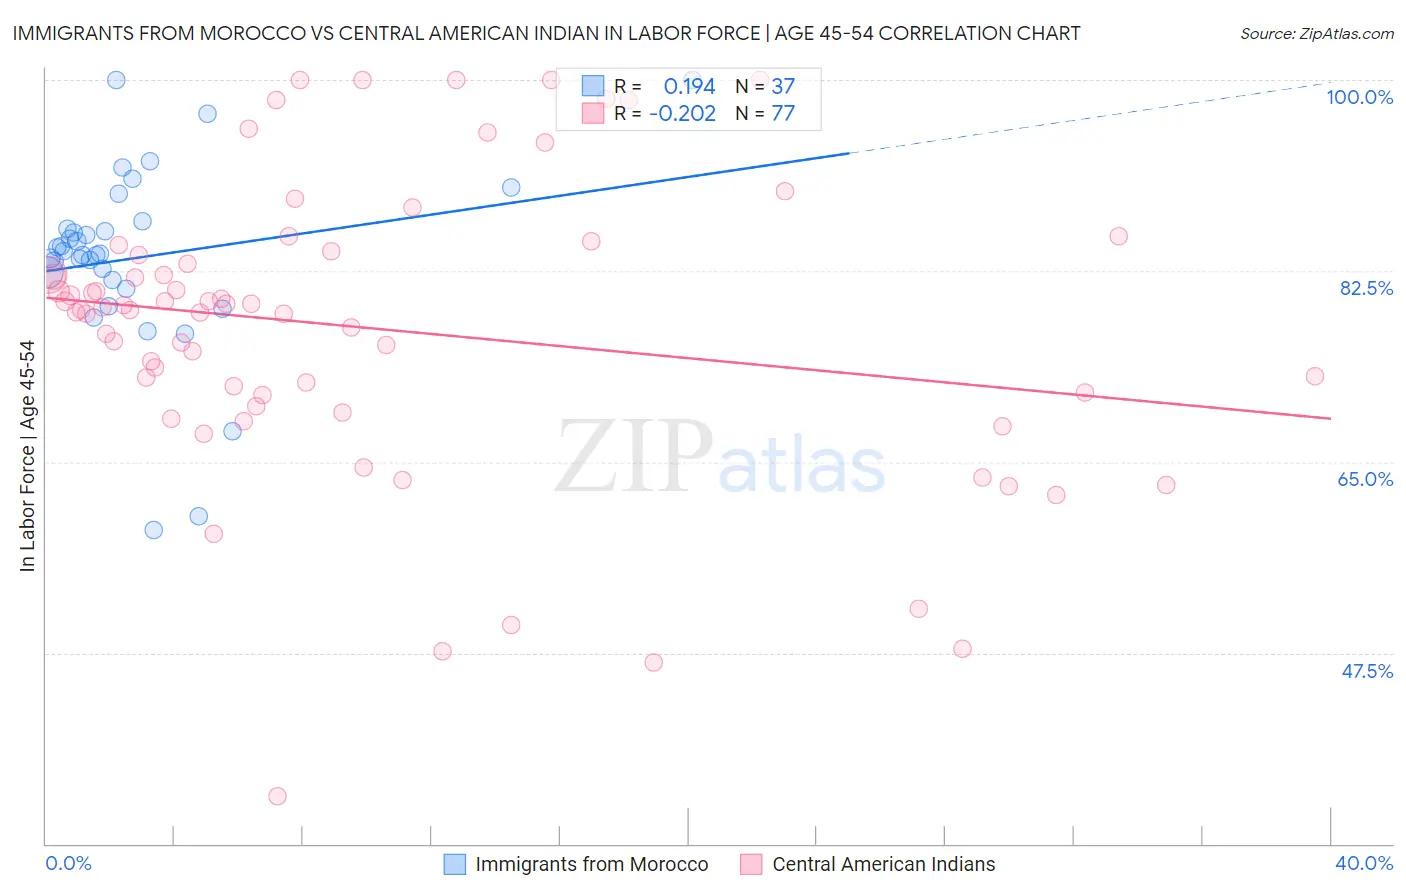
Immigrants from Morocco vs Central American Indian In Labor Force | Age 45-54 Correlation Chart
The statistical analysis conducted on geographies consisting of 178,909,930 people shows a poor positive correlation between the proportion of Immigrants from Morocco and labor force participation rate among population between the ages 45 and 54 in the United States with a correlation coefficient (R) of 0.194 and weighted average of 83.6%. Similarly, the statistical analysis conducted on geographies consisting of 326,071,382 people shows a weak negative correlation between the proportion of Central American Indians and labor force participation rate among population between the ages 45 and 54 in the United States with a correlation coefficient (R) of -0.202 and weighted average of 80.0%, a difference of 4.5%.
In Labor Force | Age 45-54 Correlation Summary
| Measurement | Immigrants from Morocco | Central American Indian |
| Minimum | 58.7% | 34.3% |
| Maximum | 100.0% | 100.0% |
| Range | 41.3% | 65.7% |
| Mean | 83.7% | 77.2% |
| Median | 84.0% | 78.9% |
| Interquartile 25% (IQ1) | 81.3% | 70.6% |
| Interquartile 75% (IQ3) | 86.7% | 84.1% |
| Interquartile Range (IQR) | 5.4% | 13.5% |
| Standard Deviation (Sample) | 8.6% | 13.6% |
| Standard Deviation (Population) | 8.5% | 13.5% |
Similar Demographics by In Labor Force | Age 45-54
Demographics Similar to Immigrants from Morocco by In Labor Force | Age 45-54
In terms of in labor force | age 45-54, the demographic groups most similar to Immigrants from Morocco are Immigrants from Poland (83.6%, a difference of 0.0%), Croatian (83.6%, a difference of 0.010%), Lithuanian (83.6%, a difference of 0.020%), Burmese (83.6%, a difference of 0.030%), and Immigrants from Hong Kong (83.6%, a difference of 0.030%).
| Demographics | Rating | Rank | In Labor Force | Age 45-54 |
| Immigrants | Moldova | 99.3 /100 | #42 | Exceptional 83.7% |
| Venezuelans | 99.2 /100 | #43 | Exceptional 83.6% |
| Burmese | 99.1 /100 | #44 | Exceptional 83.6% |
| Immigrants | Hong Kong | 99.1 /100 | #45 | Exceptional 83.6% |
| Lithuanians | 99.1 /100 | #46 | Exceptional 83.6% |
| Croatians | 99.0 /100 | #47 | Exceptional 83.6% |
| Immigrants | Poland | 99.0 /100 | #48 | Exceptional 83.6% |
| Immigrants | Morocco | 99.0 /100 | #49 | Exceptional 83.6% |
| Immigrants | Greece | 98.8 /100 | #50 | Exceptional 83.6% |
| Immigrants | Turkey | 98.8 /100 | #51 | Exceptional 83.6% |
| Poles | 98.7 /100 | #52 | Exceptional 83.6% |
| Peruvians | 98.7 /100 | #53 | Exceptional 83.6% |
| Somalis | 98.7 /100 | #54 | Exceptional 83.5% |
| Macedonians | 98.7 /100 | #55 | Exceptional 83.5% |
| Immigrants | Peru | 98.6 /100 | #56 | Exceptional 83.5% |
Demographics Similar to Central American Indians by In Labor Force | Age 45-54
In terms of in labor force | age 45-54, the demographic groups most similar to Central American Indians are Potawatomi (80.0%, a difference of 0.030%), Blackfeet (80.0%, a difference of 0.040%), Spanish American (80.1%, a difference of 0.12%), Inupiat (79.9%, a difference of 0.12%), and Hispanic or Latino (80.1%, a difference of 0.16%).
| Demographics | Rating | Rank | In Labor Force | Age 45-54 |
| Spanish American Indians | 0.0 /100 | #301 | Tragic 80.2% |
| Immigrants | Central America | 0.0 /100 | #302 | Tragic 80.2% |
| Immigrants | Azores | 0.0 /100 | #303 | Tragic 80.1% |
| Hispanics or Latinos | 0.0 /100 | #304 | Tragic 80.1% |
| Immigrants | Dominican Republic | 0.0 /100 | #305 | Tragic 80.1% |
| Spanish Americans | 0.0 /100 | #306 | Tragic 80.1% |
| Blackfeet | 0.0 /100 | #307 | Tragic 80.0% |
| Central American Indians | 0.0 /100 | #308 | Tragic 80.0% |
| Potawatomi | 0.0 /100 | #309 | Tragic 80.0% |
| Inupiat | 0.0 /100 | #310 | Tragic 79.9% |
| Mexicans | 0.0 /100 | #311 | Tragic 79.8% |
| Immigrants | Mexico | 0.0 /100 | #312 | Tragic 79.7% |
| Colville | 0.0 /100 | #313 | Tragic 79.5% |
| Ottawa | 0.0 /100 | #314 | Tragic 79.5% |
| Blacks/African Americans | 0.0 /100 | #315 | Tragic 79.3% |