Immigrants from Morocco vs Immigrants from Nigeria In Labor Force | Age 16-19
COMPARE
Immigrants from Morocco
Immigrants from Nigeria
In Labor Force | Age 16-19
In Labor Force | Age 16-19 Comparison
Immigrants from Morocco
Immigrants from Nigeria
36.4%
IN LABOR FORCE | AGE 16-19
41.1/ 100
METRIC RATING
180th/ 347
METRIC RANK
35.8%
IN LABOR FORCE | AGE 16-19
16.8/ 100
METRIC RATING
203rd/ 347
METRIC RANK
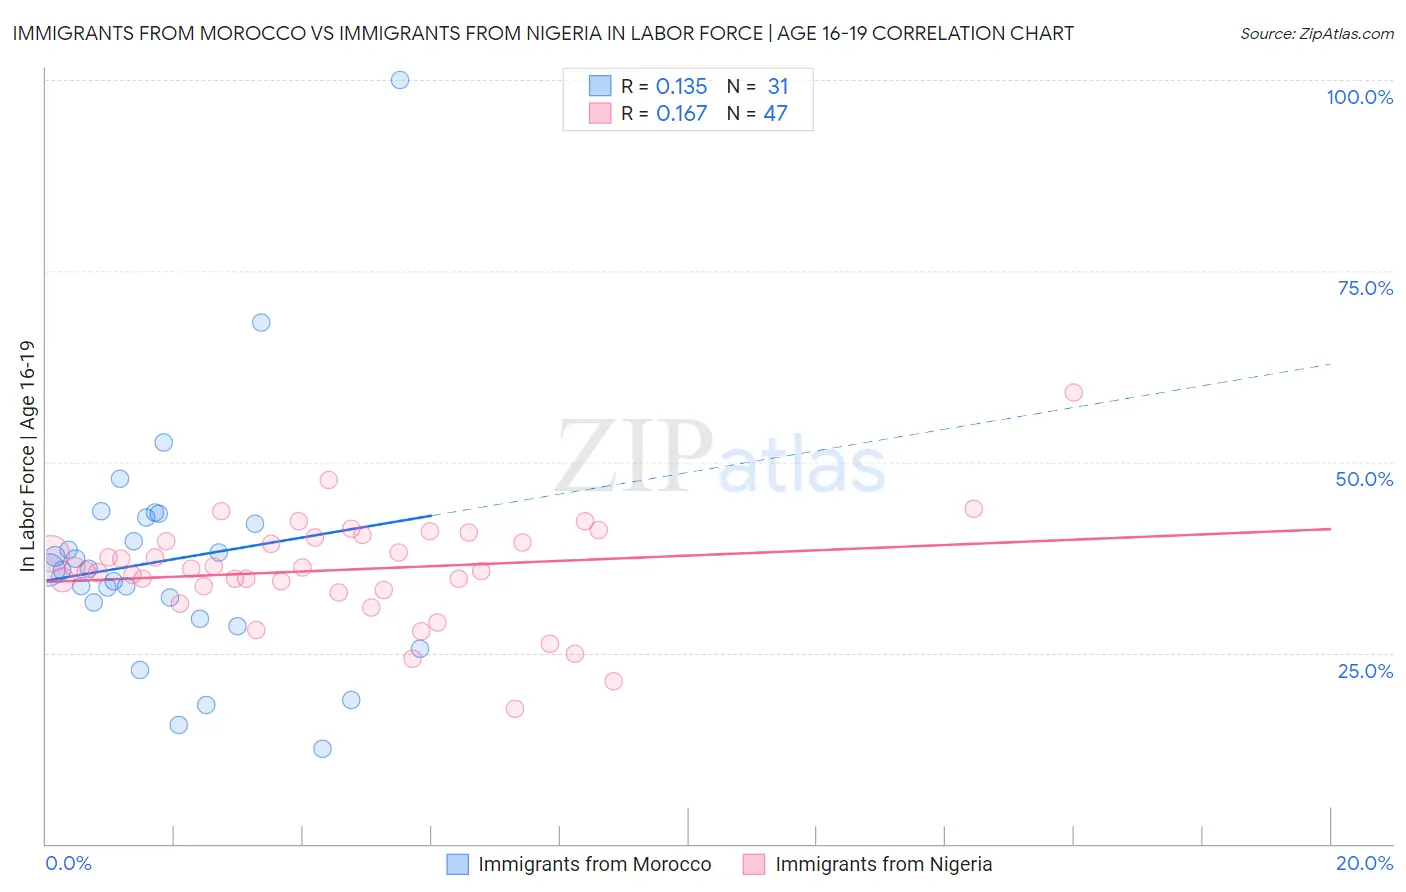
Immigrants from Morocco vs Immigrants from Nigeria In Labor Force | Age 16-19 Correlation Chart
The statistical analysis conducted on geographies consisting of 178,800,996 people shows a poor positive correlation between the proportion of Immigrants from Morocco and labor force participation rate among population between the ages 16 and 19 in the United States with a correlation coefficient (R) of 0.135 and weighted average of 36.4%. Similarly, the statistical analysis conducted on geographies consisting of 283,352,648 people shows a poor positive correlation between the proportion of Immigrants from Nigeria and labor force participation rate among population between the ages 16 and 19 in the United States with a correlation coefficient (R) of 0.167 and weighted average of 35.8%, a difference of 1.6%.
In Labor Force | Age 16-19 Correlation Summary
| Measurement | Immigrants from Morocco | Immigrants from Nigeria |
| Minimum | 12.5% | 17.6% |
| Maximum | 100.0% | 59.1% |
| Range | 87.5% | 41.5% |
| Mean | 37.2% | 35.9% |
| Median | 35.9% | 35.9% |
| Interquartile 25% (IQ1) | 29.4% | 33.2% |
| Interquartile 75% (IQ3) | 42.6% | 40.2% |
| Interquartile Range (IQR) | 13.2% | 6.9% |
| Standard Deviation (Sample) | 16.1% | 7.0% |
| Standard Deviation (Population) | 15.9% | 6.9% |
Similar Demographics by In Labor Force | Age 16-19
Demographics Similar to Immigrants from Morocco by In Labor Force | Age 16-19
In terms of in labor force | age 16-19, the demographic groups most similar to Immigrants from Morocco are Jordanian (36.4%, a difference of 0.080%), Immigrants from Italy (36.4%, a difference of 0.10%), Immigrants from Southern Europe (36.4%, a difference of 0.12%), Eastern European (36.4%, a difference of 0.12%), and Black/African American (36.5%, a difference of 0.21%).
| Demographics | Rating | Rank | In Labor Force | Age 16-19 |
| Russians | 57.5 /100 | #173 | Average 36.7% |
| Immigrants | Czechoslovakia | 50.0 /100 | #174 | Average 36.6% |
| Natives/Alaskans | 49.0 /100 | #175 | Average 36.6% |
| Albanians | 48.8 /100 | #176 | Average 36.5% |
| Immigrants | Northern Europe | 46.6 /100 | #177 | Average 36.5% |
| Blacks/African Americans | 45.1 /100 | #178 | Average 36.5% |
| Immigrants | Southern Europe | 43.3 /100 | #179 | Average 36.4% |
| Immigrants | Morocco | 41.1 /100 | #180 | Average 36.4% |
| Jordanians | 39.6 /100 | #181 | Fair 36.4% |
| Immigrants | Italy | 39.1 /100 | #182 | Fair 36.4% |
| Eastern Europeans | 38.8 /100 | #183 | Fair 36.4% |
| Costa Ricans | 36.1 /100 | #184 | Fair 36.3% |
| Bhutanese | 35.3 /100 | #185 | Fair 36.3% |
| Immigrants | Romania | 34.0 /100 | #186 | Fair 36.3% |
| Immigrants | Afghanistan | 34.0 /100 | #187 | Fair 36.3% |
Demographics Similar to Immigrants from Nigeria by In Labor Force | Age 16-19
In terms of in labor force | age 16-19, the demographic groups most similar to Immigrants from Nigeria are Senegalese (35.9%, a difference of 0.060%), Alsatian (35.9%, a difference of 0.070%), Immigrants from Albania (35.8%, a difference of 0.17%), Immigrants from Sweden (35.9%, a difference of 0.18%), and South American Indian (35.8%, a difference of 0.21%).
| Demographics | Rating | Rank | In Labor Force | Age 16-19 |
| Mexican American Indians | 21.1 /100 | #196 | Fair 36.0% |
| Immigrants | Serbia | 21.0 /100 | #197 | Fair 36.0% |
| Immigrants | Northern Africa | 19.9 /100 | #198 | Poor 35.9% |
| Immigrants | Norway | 19.8 /100 | #199 | Poor 35.9% |
| Immigrants | Sweden | 18.8 /100 | #200 | Poor 35.9% |
| Alsatians | 17.5 /100 | #201 | Poor 35.9% |
| Senegalese | 17.4 /100 | #202 | Poor 35.9% |
| Immigrants | Nigeria | 16.8 /100 | #203 | Poor 35.8% |
| Immigrants | Albania | 15.0 /100 | #204 | Poor 35.8% |
| South American Indians | 14.6 /100 | #205 | Poor 35.8% |
| Chileans | 14.6 /100 | #206 | Poor 35.8% |
| Immigrants | Eastern Europe | 14.5 /100 | #207 | Poor 35.8% |
| Koreans | 13.3 /100 | #208 | Poor 35.7% |
| Moroccans | 12.7 /100 | #209 | Poor 35.7% |
| Immigrants | Switzerland | 11.9 /100 | #210 | Poor 35.6% |