Immigrants from Middle Africa vs Immigrants from Western Europe Female Disability
COMPARE
Immigrants from Middle Africa
Immigrants from Western Europe
Female Disability
Female Disability Comparison
Immigrants from Middle Africa
Immigrants from Western Europe
12.1%
FEMALE DISABILITY
72.4/ 100
METRIC RATING
158th/ 347
METRIC RANK
12.2%
FEMALE DISABILITY
40.9/ 100
METRIC RATING
178th/ 347
METRIC RANK
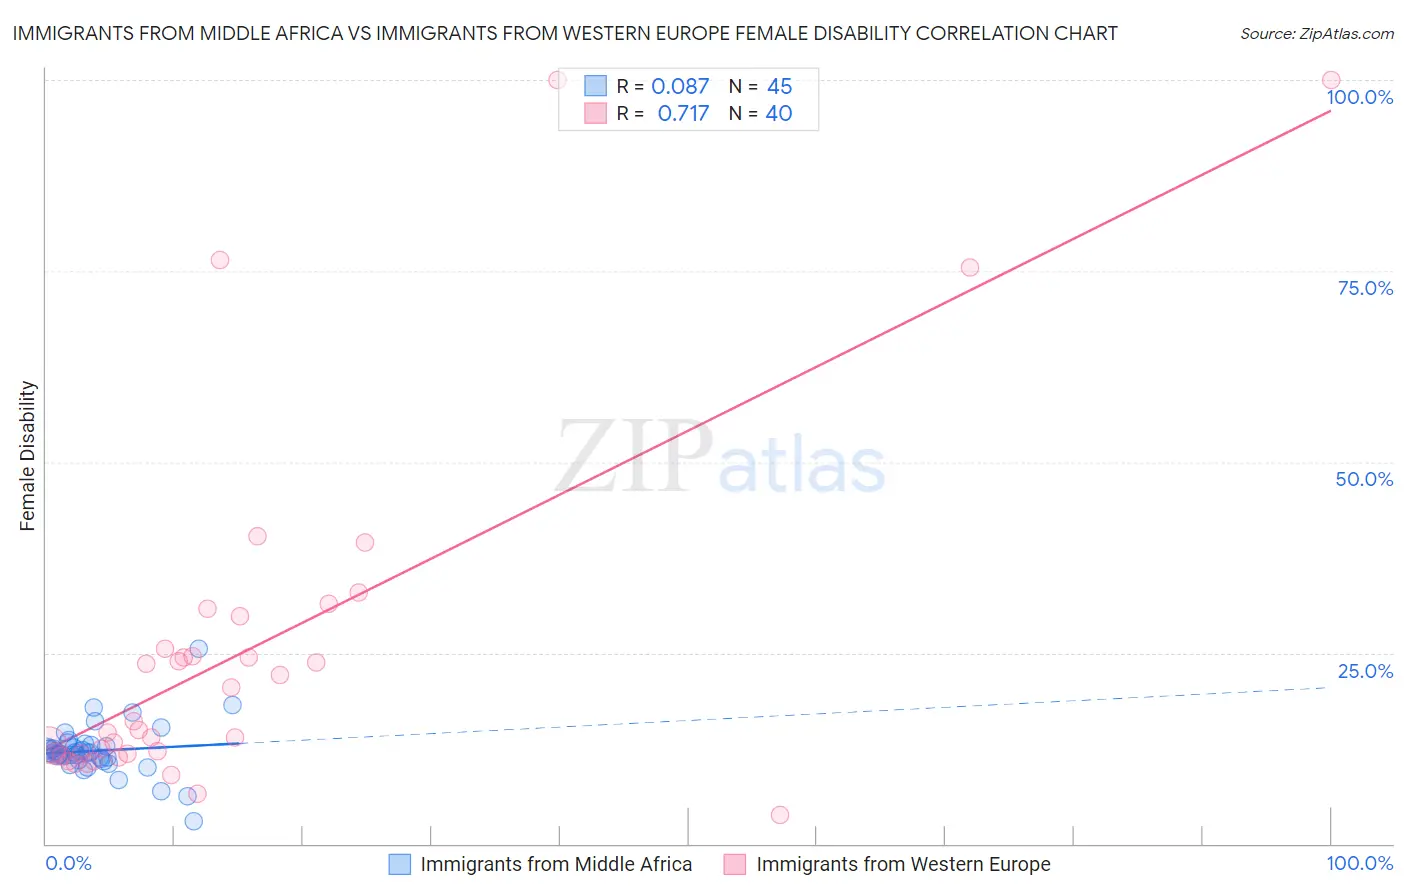
Immigrants from Middle Africa vs Immigrants from Western Europe Female Disability Correlation Chart
The statistical analysis conducted on geographies consisting of 202,716,278 people shows a slight positive correlation between the proportion of Immigrants from Middle Africa and percentage of females with a disability in the United States with a correlation coefficient (R) of 0.087 and weighted average of 12.1%. Similarly, the statistical analysis conducted on geographies consisting of 494,007,860 people shows a strong positive correlation between the proportion of Immigrants from Western Europe and percentage of females with a disability in the United States with a correlation coefficient (R) of 0.717 and weighted average of 12.2%, a difference of 1.3%.
Female Disability Correlation Summary
| Measurement | Immigrants from Middle Africa | Immigrants from Western Europe |
| Minimum | 2.9% | 3.8% |
| Maximum | 25.5% | 100.0% |
| Range | 22.6% | 96.2% |
| Mean | 12.2% | 25.3% |
| Median | 11.9% | 15.5% |
| Interquartile 25% (IQ1) | 11.1% | 11.8% |
| Interquartile 75% (IQ3) | 12.8% | 27.7% |
| Interquartile Range (IQR) | 1.7% | 15.9% |
| Standard Deviation (Sample) | 3.4% | 23.2% |
| Standard Deviation (Population) | 3.3% | 22.9% |
Demographics Similar to Immigrants from Middle Africa and Immigrants from Western Europe by Female Disability
In terms of female disability, the demographic groups most similar to Immigrants from Middle Africa are Immigrants from Central America (12.1%, a difference of 0.21%), Immigrants from Guatemala (12.1%, a difference of 0.28%), Guyanese (12.1%, a difference of 0.34%), Immigrants from Ukraine (12.1%, a difference of 0.35%), and Guatemalan (12.1%, a difference of 0.37%). Similarly, the demographic groups most similar to Immigrants from Western Europe are Immigrants from Ghana (12.2%, a difference of 0.060%), Immigrants from Guyana (12.2%, a difference of 0.080%), Immigrants from St. Vincent and the Grenadines (12.2%, a difference of 0.34%), Immigrants from England (12.2%, a difference of 0.35%), and Immigrants from Mexico (12.2%, a difference of 0.38%).
| Demographics | Rating | Rank | Female Disability |
| Immigrants | Middle Africa | 72.4 /100 | #158 | Good 12.1% |
| Immigrants | Central America | 67.7 /100 | #159 | Good 12.1% |
| Immigrants | Guatemala | 66.0 /100 | #160 | Good 12.1% |
| Guyanese | 64.7 /100 | #161 | Good 12.1% |
| Immigrants | Ukraine | 64.3 /100 | #162 | Good 12.1% |
| Guatemalans | 63.8 /100 | #163 | Good 12.1% |
| Czechs | 63.6 /100 | #164 | Good 12.1% |
| Immigrants | Oceania | 61.8 /100 | #165 | Good 12.1% |
| Lithuanians | 59.5 /100 | #166 | Average 12.2% |
| Immigrants | Latin America | 59.0 /100 | #167 | Average 12.2% |
| Immigrants | Haiti | 58.8 /100 | #168 | Average 12.2% |
| Lebanese | 58.1 /100 | #169 | Average 12.2% |
| Maltese | 57.0 /100 | #170 | Average 12.2% |
| Immigrants | Southern Europe | 56.3 /100 | #171 | Average 12.2% |
| Haitians | 51.9 /100 | #172 | Average 12.2% |
| Immigrants | Mexico | 50.8 /100 | #173 | Average 12.2% |
| Immigrants | England | 50.0 /100 | #174 | Average 12.2% |
| Immigrants | St. Vincent and the Grenadines | 49.7 /100 | #175 | Average 12.2% |
| Immigrants | Guyana | 43.1 /100 | #176 | Average 12.2% |
| Immigrants | Ghana | 42.5 /100 | #177 | Average 12.2% |
| Immigrants | Western Europe | 40.9 /100 | #178 | Average 12.2% |