Immigrants from Micronesia vs U.S. Virgin Islander In Labor Force | Age 20-64
COMPARE
Immigrants from Micronesia
U.S. Virgin Islander
In Labor Force | Age 20-64
In Labor Force | Age 20-64 Comparison
Immigrants from Micronesia
U.S. Virgin Islanders
78.9%
IN LABOR FORCE | AGE 20-64
1.9/ 100
METRIC RATING
242nd/ 347
METRIC RANK
78.4%
IN LABOR FORCE | AGE 20-64
0.1/ 100
METRIC RATING
267th/ 347
METRIC RANK
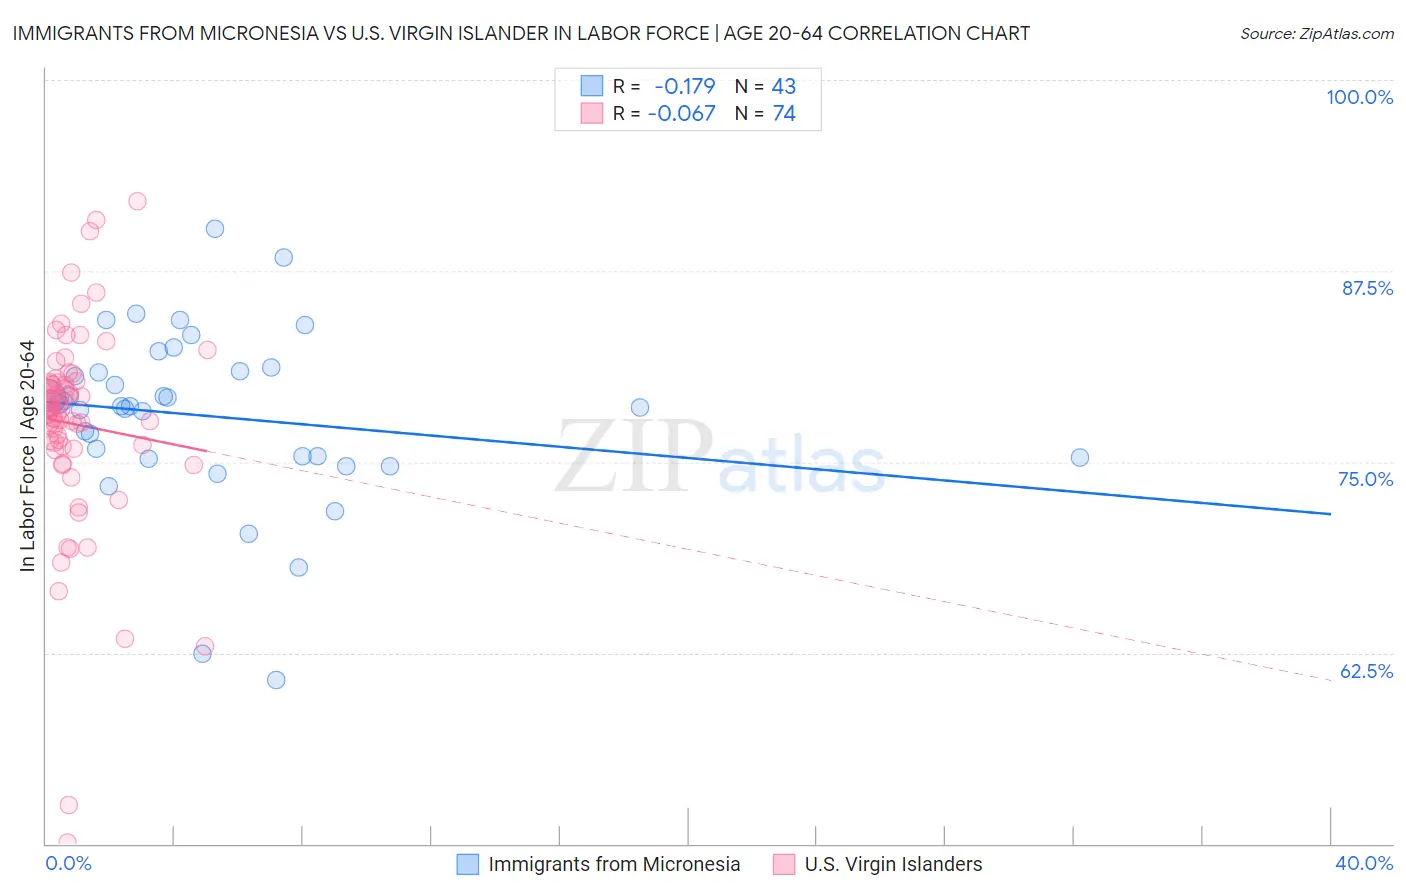
Immigrants from Micronesia vs U.S. Virgin Islander In Labor Force | Age 20-64 Correlation Chart
The statistical analysis conducted on geographies consisting of 61,600,666 people shows a poor negative correlation between the proportion of Immigrants from Micronesia and labor force participation rate among population between the ages 20 and 64 in the United States with a correlation coefficient (R) of -0.179 and weighted average of 78.9%. Similarly, the statistical analysis conducted on geographies consisting of 87,527,161 people shows a slight negative correlation between the proportion of U.S. Virgin Islanders and labor force participation rate among population between the ages 20 and 64 in the United States with a correlation coefficient (R) of -0.067 and weighted average of 78.4%, a difference of 0.73%.
In Labor Force | Age 20-64 Correlation Summary
| Measurement | Immigrants from Micronesia | U.S. Virgin Islander |
| Minimum | 60.7% | 50.1% |
| Maximum | 90.3% | 92.1% |
| Range | 29.6% | 42.0% |
| Mean | 78.0% | 77.5% |
| Median | 78.7% | 78.4% |
| Interquartile 25% (IQ1) | 75.3% | 76.0% |
| Interquartile 75% (IQ3) | 80.9% | 80.2% |
| Interquartile Range (IQR) | 5.6% | 4.2% |
| Standard Deviation (Sample) | 5.7% | 6.9% |
| Standard Deviation (Population) | 5.6% | 6.8% |
Similar Demographics by In Labor Force | Age 20-64
Demographics Similar to Immigrants from Micronesia by In Labor Force | Age 20-64
In terms of in labor force | age 20-64, the demographic groups most similar to Immigrants from Micronesia are Jamaican (78.9%, a difference of 0.010%), Immigrants from West Indies (78.9%, a difference of 0.020%), Welsh (79.0%, a difference of 0.040%), Trinidadian and Tobagonian (79.0%, a difference of 0.040%), and French (78.9%, a difference of 0.050%).
| Demographics | Rating | Rank | In Labor Force | Age 20-64 |
| Tlingit-Haida | 3.2 /100 | #235 | Tragic 79.0% |
| Samoans | 2.9 /100 | #236 | Tragic 79.0% |
| Immigrants | North America | 2.9 /100 | #237 | Tragic 79.0% |
| Immigrants | Jamaica | 2.6 /100 | #238 | Tragic 79.0% |
| Welsh | 2.4 /100 | #239 | Tragic 79.0% |
| Trinidadians and Tobagonians | 2.3 /100 | #240 | Tragic 79.0% |
| Jamaicans | 2.0 /100 | #241 | Tragic 78.9% |
| Immigrants | Micronesia | 1.9 /100 | #242 | Tragic 78.9% |
| Immigrants | West Indies | 1.7 /100 | #243 | Tragic 78.9% |
| French | 1.5 /100 | #244 | Tragic 78.9% |
| Scottish | 1.3 /100 | #245 | Tragic 78.9% |
| Immigrants | Trinidad and Tobago | 1.1 /100 | #246 | Tragic 78.8% |
| Immigrants | Germany | 1.0 /100 | #247 | Tragic 78.8% |
| Immigrants | Caribbean | 1.0 /100 | #248 | Tragic 78.8% |
| English | 0.9 /100 | #249 | Tragic 78.8% |
Demographics Similar to U.S. Virgin Islanders by In Labor Force | Age 20-64
In terms of in labor force | age 20-64, the demographic groups most similar to U.S. Virgin Islanders are Bahamian (78.4%, a difference of 0.020%), West Indian (78.3%, a difference of 0.020%), British West Indian (78.4%, a difference of 0.030%), Pennsylvania German (78.4%, a difference of 0.070%), and Spaniard (78.4%, a difference of 0.070%).
| Demographics | Rating | Rank | In Labor Force | Age 20-64 |
| Immigrants | Fiji | 0.3 /100 | #260 | Tragic 78.6% |
| Whites/Caucasians | 0.2 /100 | #261 | Tragic 78.5% |
| Fijians | 0.1 /100 | #262 | Tragic 78.4% |
| Pennsylvania Germans | 0.1 /100 | #263 | Tragic 78.4% |
| Spaniards | 0.1 /100 | #264 | Tragic 78.4% |
| British West Indians | 0.1 /100 | #265 | Tragic 78.4% |
| Bahamians | 0.1 /100 | #266 | Tragic 78.4% |
| U.S. Virgin Islanders | 0.1 /100 | #267 | Tragic 78.4% |
| West Indians | 0.0 /100 | #268 | Tragic 78.3% |
| Immigrants | Barbados | 0.0 /100 | #269 | Tragic 78.3% |
| Scotch-Irish | 0.0 /100 | #270 | Tragic 78.3% |
| Immigrants | Latin America | 0.0 /100 | #271 | Tragic 78.3% |
| Marshallese | 0.0 /100 | #272 | Tragic 78.3% |
| French American Indians | 0.0 /100 | #273 | Tragic 78.2% |
| Aleuts | 0.0 /100 | #274 | Tragic 78.2% |