Immigrants from Japan vs U.S. Virgin Islander In Labor Force | Age 20-64
COMPARE
Immigrants from Japan
U.S. Virgin Islander
In Labor Force | Age 20-64
In Labor Force | Age 20-64 Comparison
Immigrants from Japan
U.S. Virgin Islanders
80.1%
IN LABOR FORCE | AGE 20-64
97.3/ 100
METRIC RATING
82nd/ 347
METRIC RANK
78.4%
IN LABOR FORCE | AGE 20-64
0.1/ 100
METRIC RATING
267th/ 347
METRIC RANK
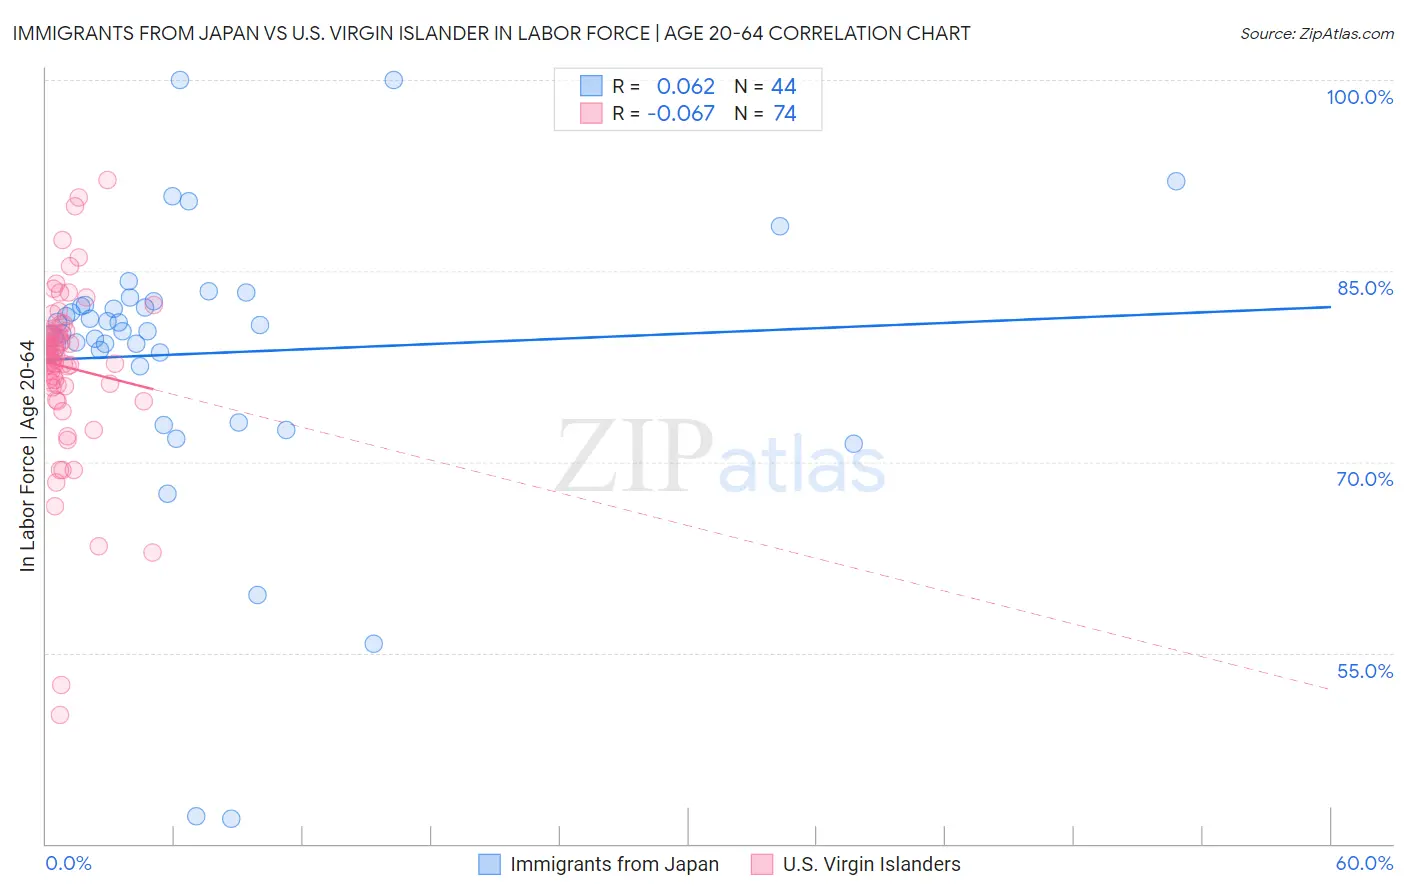
Immigrants from Japan vs U.S. Virgin Islander In Labor Force | Age 20-64 Correlation Chart
The statistical analysis conducted on geographies consisting of 340,160,154 people shows a slight positive correlation between the proportion of Immigrants from Japan and labor force participation rate among population between the ages 20 and 64 in the United States with a correlation coefficient (R) of 0.062 and weighted average of 80.1%. Similarly, the statistical analysis conducted on geographies consisting of 87,527,161 people shows a slight negative correlation between the proportion of U.S. Virgin Islanders and labor force participation rate among population between the ages 20 and 64 in the United States with a correlation coefficient (R) of -0.067 and weighted average of 78.4%, a difference of 2.3%.
In Labor Force | Age 20-64 Correlation Summary
| Measurement | Immigrants from Japan | U.S. Virgin Islander |
| Minimum | 42.0% | 50.1% |
| Maximum | 100.0% | 92.1% |
| Range | 58.0% | 42.0% |
| Mean | 78.5% | 77.5% |
| Median | 80.5% | 78.4% |
| Interquartile 25% (IQ1) | 78.1% | 76.0% |
| Interquartile 75% (IQ3) | 82.5% | 80.2% |
| Interquartile Range (IQR) | 4.4% | 4.2% |
| Standard Deviation (Sample) | 11.4% | 6.9% |
| Standard Deviation (Population) | 11.3% | 6.8% |
Similar Demographics by In Labor Force | Age 20-64
Demographics Similar to Immigrants from Japan by In Labor Force | Age 20-64
In terms of in labor force | age 20-64, the demographic groups most similar to Immigrants from Japan are German Russian (80.1%, a difference of 0.0%), Colombian (80.1%, a difference of 0.0%), Immigrants from Latvia (80.1%, a difference of 0.010%), Jordanian (80.1%, a difference of 0.010%), and Immigrants from Egypt (80.1%, a difference of 0.010%).
| Demographics | Rating | Rank | In Labor Force | Age 20-64 |
| Immigrants | Afghanistan | 97.9 /100 | #75 | Exceptional 80.2% |
| Egyptians | 97.8 /100 | #76 | Exceptional 80.2% |
| Immigrants | Colombia | 97.8 /100 | #77 | Exceptional 80.2% |
| Immigrants | Romania | 97.8 /100 | #78 | Exceptional 80.2% |
| Asians | 97.7 /100 | #79 | Exceptional 80.2% |
| Immigrants | Croatia | 97.6 /100 | #80 | Exceptional 80.1% |
| German Russians | 97.3 /100 | #81 | Exceptional 80.1% |
| Immigrants | Japan | 97.3 /100 | #82 | Exceptional 80.1% |
| Colombians | 97.3 /100 | #83 | Exceptional 80.1% |
| Immigrants | Latvia | 97.2 /100 | #84 | Exceptional 80.1% |
| Jordanians | 97.2 /100 | #85 | Exceptional 80.1% |
| Immigrants | Egypt | 97.1 /100 | #86 | Exceptional 80.1% |
| Croatians | 97.1 /100 | #87 | Exceptional 80.1% |
| Chileans | 97.0 /100 | #88 | Exceptional 80.1% |
| Immigrants | Venezuela | 96.8 /100 | #89 | Exceptional 80.1% |
Demographics Similar to U.S. Virgin Islanders by In Labor Force | Age 20-64
In terms of in labor force | age 20-64, the demographic groups most similar to U.S. Virgin Islanders are Bahamian (78.4%, a difference of 0.020%), West Indian (78.3%, a difference of 0.020%), British West Indian (78.4%, a difference of 0.030%), Pennsylvania German (78.4%, a difference of 0.070%), and Spaniard (78.4%, a difference of 0.070%).
| Demographics | Rating | Rank | In Labor Force | Age 20-64 |
| Immigrants | Fiji | 0.3 /100 | #260 | Tragic 78.6% |
| Whites/Caucasians | 0.2 /100 | #261 | Tragic 78.5% |
| Fijians | 0.1 /100 | #262 | Tragic 78.4% |
| Pennsylvania Germans | 0.1 /100 | #263 | Tragic 78.4% |
| Spaniards | 0.1 /100 | #264 | Tragic 78.4% |
| British West Indians | 0.1 /100 | #265 | Tragic 78.4% |
| Bahamians | 0.1 /100 | #266 | Tragic 78.4% |
| U.S. Virgin Islanders | 0.1 /100 | #267 | Tragic 78.4% |
| West Indians | 0.0 /100 | #268 | Tragic 78.3% |
| Immigrants | Barbados | 0.0 /100 | #269 | Tragic 78.3% |
| Scotch-Irish | 0.0 /100 | #270 | Tragic 78.3% |
| Immigrants | Latin America | 0.0 /100 | #271 | Tragic 78.3% |
| Marshallese | 0.0 /100 | #272 | Tragic 78.3% |
| French American Indians | 0.0 /100 | #273 | Tragic 78.2% |
| Aleuts | 0.0 /100 | #274 | Tragic 78.2% |