Immigrants from Micronesia vs Immigrants from Panama In Labor Force | Age 45-54
COMPARE
Immigrants from Micronesia
Immigrants from Panama
In Labor Force | Age 45-54
In Labor Force | Age 45-54 Comparison
Immigrants from Micronesia
Immigrants from Panama
81.1%
IN LABOR FORCE | AGE 45-54
0.0/ 100
METRIC RATING
279th/ 347
METRIC RANK
82.2%
IN LABOR FORCE | AGE 45-54
5.6/ 100
METRIC RATING
214th/ 347
METRIC RANK
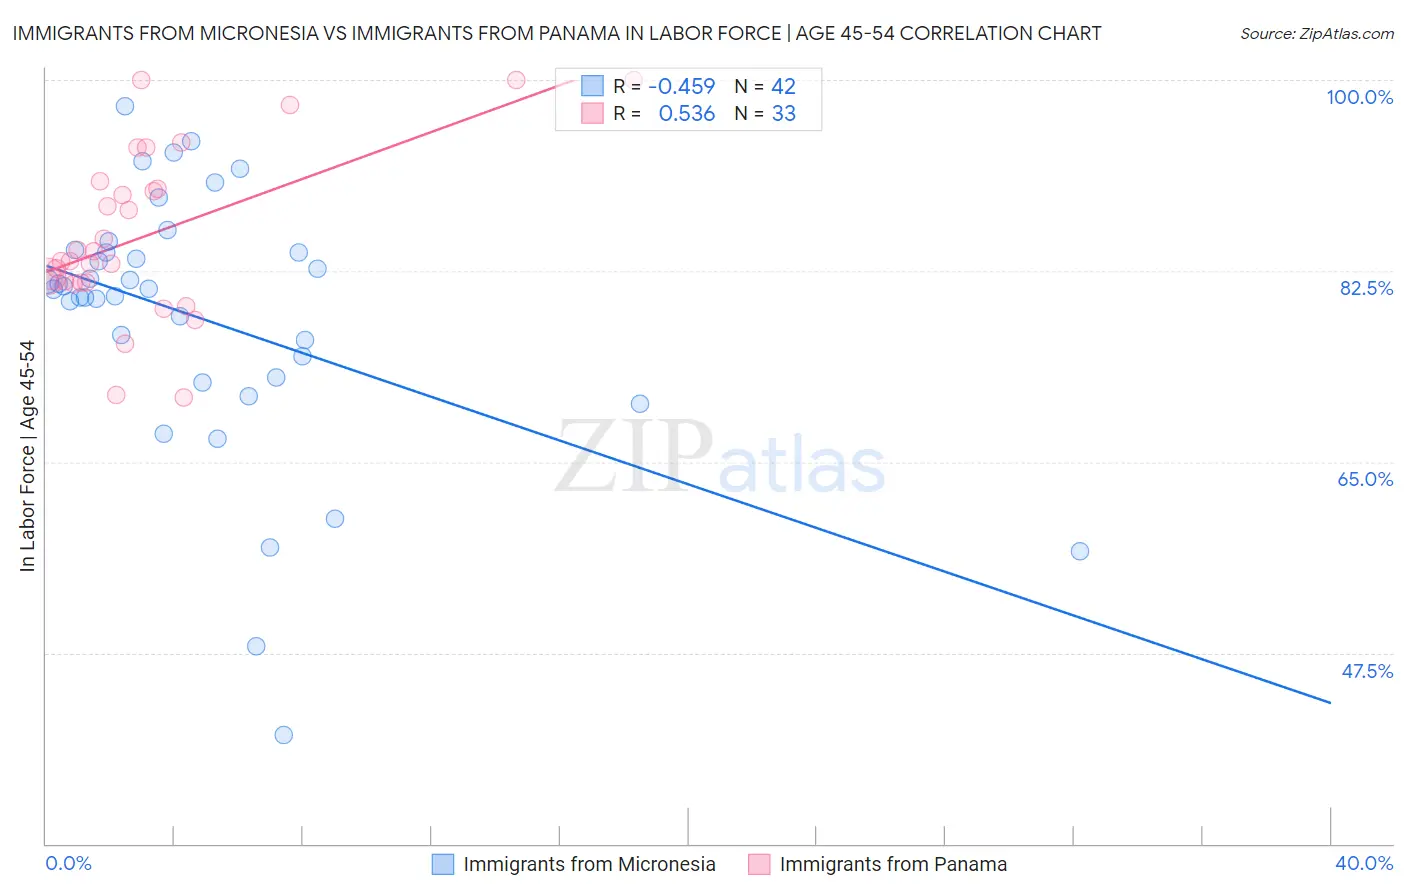
Immigrants from Micronesia vs Immigrants from Panama In Labor Force | Age 45-54 Correlation Chart
The statistical analysis conducted on geographies consisting of 61,599,653 people shows a moderate negative correlation between the proportion of Immigrants from Micronesia and labor force participation rate among population between the ages 45 and 54 in the United States with a correlation coefficient (R) of -0.459 and weighted average of 81.1%. Similarly, the statistical analysis conducted on geographies consisting of 221,155,695 people shows a substantial positive correlation between the proportion of Immigrants from Panama and labor force participation rate among population between the ages 45 and 54 in the United States with a correlation coefficient (R) of 0.536 and weighted average of 82.2%, a difference of 1.4%.
In Labor Force | Age 45-54 Correlation Summary
| Measurement | Immigrants from Micronesia | Immigrants from Panama |
| Minimum | 40.0% | 70.9% |
| Maximum | 97.6% | 100.0% |
| Range | 57.6% | 29.1% |
| Mean | 78.1% | 85.8% |
| Median | 80.8% | 83.4% |
| Interquartile 25% (IQ1) | 72.7% | 81.5% |
| Interquartile 75% (IQ3) | 84.2% | 90.3% |
| Interquartile Range (IQR) | 11.5% | 8.9% |
| Standard Deviation (Sample) | 12.1% | 7.6% |
| Standard Deviation (Population) | 11.9% | 7.5% |
Similar Demographics by In Labor Force | Age 45-54
Demographics Similar to Immigrants from Micronesia by In Labor Force | Age 45-54
In terms of in labor force | age 45-54, the demographic groups most similar to Immigrants from Micronesia are Immigrants from Guatemala (81.1%, a difference of 0.010%), Guatemalan (81.2%, a difference of 0.090%), U.S. Virgin Islander (81.2%, a difference of 0.11%), Immigrants from Latin America (81.0%, a difference of 0.11%), and Immigrants from Grenada (81.0%, a difference of 0.11%).
| Demographics | Rating | Rank | In Labor Force | Age 45-54 |
| Spanish | 0.0 /100 | #272 | Tragic 81.3% |
| Chippewa | 0.0 /100 | #273 | Tragic 81.3% |
| British West Indians | 0.0 /100 | #274 | Tragic 81.2% |
| Immigrants | Nonimmigrants | 0.0 /100 | #275 | Tragic 81.2% |
| U.S. Virgin Islanders | 0.0 /100 | #276 | Tragic 81.2% |
| Guatemalans | 0.0 /100 | #277 | Tragic 81.2% |
| Immigrants | Guatemala | 0.0 /100 | #278 | Tragic 81.1% |
| Immigrants | Micronesia | 0.0 /100 | #279 | Tragic 81.1% |
| Immigrants | Latin America | 0.0 /100 | #280 | Tragic 81.0% |
| Immigrants | Grenada | 0.0 /100 | #281 | Tragic 81.0% |
| Aleuts | 0.0 /100 | #282 | Tragic 81.0% |
| French American Indians | 0.0 /100 | #283 | Tragic 80.8% |
| Belizeans | 0.0 /100 | #284 | Tragic 80.8% |
| Delaware | 0.0 /100 | #285 | Tragic 80.8% |
| Immigrants | Dominica | 0.0 /100 | #286 | Tragic 80.8% |
Demographics Similar to Immigrants from Panama by In Labor Force | Age 45-54
In terms of in labor force | age 45-54, the demographic groups most similar to Immigrants from Panama are Iraqi (82.2%, a difference of 0.0%), Immigrants from Uzbekistan (82.3%, a difference of 0.010%), Scottish (82.2%, a difference of 0.010%), Ecuadorian (82.3%, a difference of 0.030%), and Immigrants from Syria (82.3%, a difference of 0.040%).
| Demographics | Rating | Rank | In Labor Force | Age 45-54 |
| Immigrants | Cabo Verde | 8.6 /100 | #207 | Tragic 82.3% |
| Native Hawaiians | 8.5 /100 | #208 | Tragic 82.3% |
| Immigrants | Lebanon | 7.4 /100 | #209 | Tragic 82.3% |
| Immigrants | Bahamas | 7.1 /100 | #210 | Tragic 82.3% |
| Immigrants | Syria | 6.6 /100 | #211 | Tragic 82.3% |
| Ecuadorians | 6.3 /100 | #212 | Tragic 82.3% |
| Immigrants | Uzbekistan | 5.8 /100 | #213 | Tragic 82.3% |
| Immigrants | Panama | 5.6 /100 | #214 | Tragic 82.2% |
| Iraqis | 5.6 /100 | #215 | Tragic 82.2% |
| Scottish | 5.3 /100 | #216 | Tragic 82.2% |
| Portuguese | 4.7 /100 | #217 | Tragic 82.2% |
| English | 4.4 /100 | #218 | Tragic 82.2% |
| French | 4.1 /100 | #219 | Tragic 82.2% |
| Bahamians | 3.6 /100 | #220 | Tragic 82.2% |
| Panamanians | 3.5 /100 | #221 | Tragic 82.2% |