Immigrants from England vs Immigrants from Colombia In Labor Force | Age 25-29
COMPARE
Immigrants from England
Immigrants from Colombia
In Labor Force | Age 25-29
In Labor Force | Age 25-29 Comparison
Immigrants from England
Immigrants from Colombia
84.7%
IN LABOR FORCE | AGE 25-29
65.2/ 100
METRIC RATING
148th/ 347
METRIC RANK
84.7%
IN LABOR FORCE | AGE 25-29
58.3/ 100
METRIC RATING
162nd/ 347
METRIC RANK
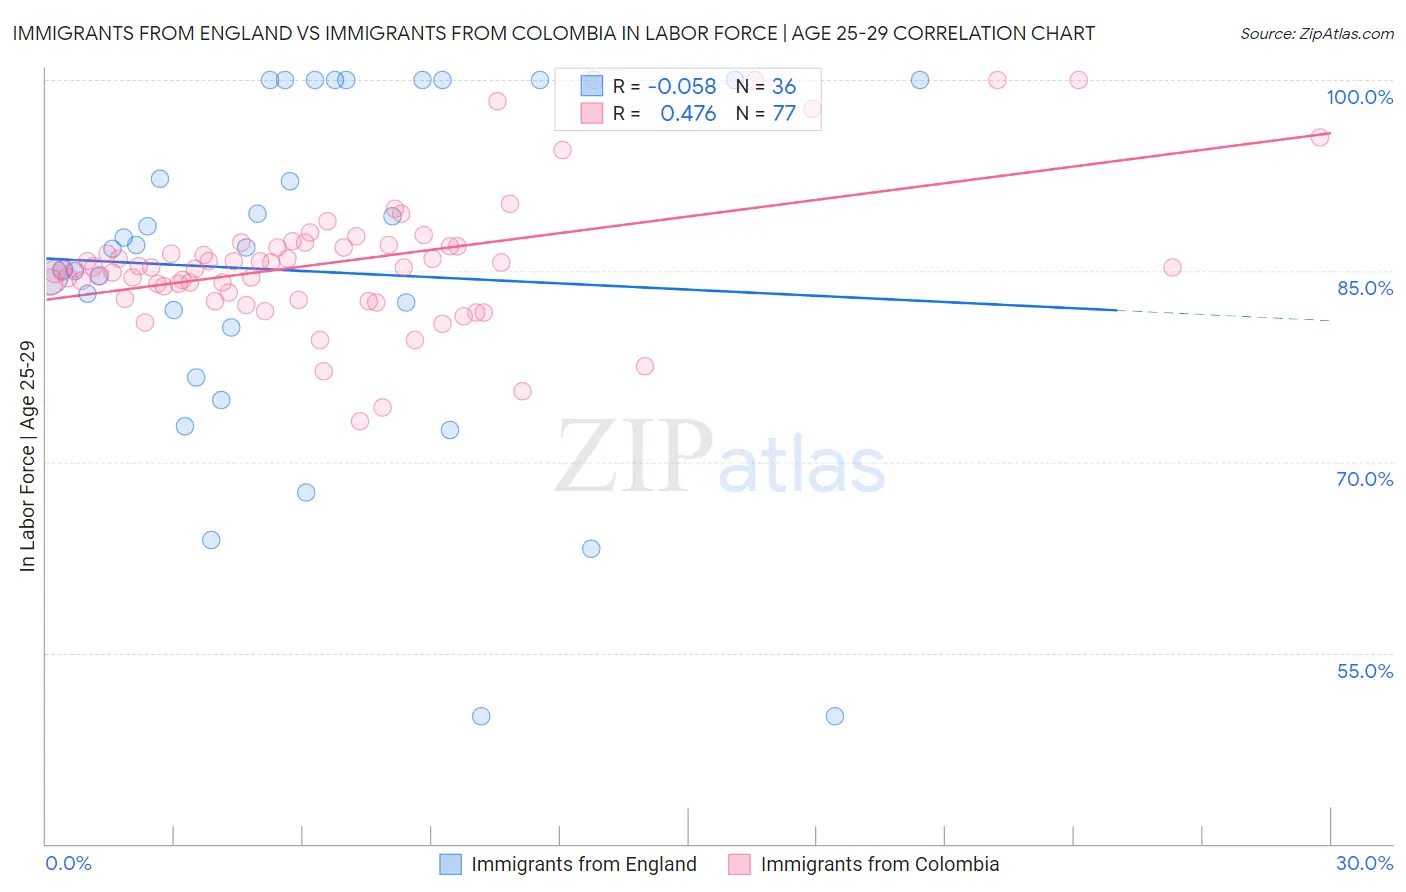
Immigrants from England vs Immigrants from Colombia In Labor Force | Age 25-29 Correlation Chart
The statistical analysis conducted on geographies consisting of 391,692,823 people shows a slight negative correlation between the proportion of Immigrants from England and labor force participation rate among population between the ages 25 and 29 in the United States with a correlation coefficient (R) of -0.058 and weighted average of 84.7%. Similarly, the statistical analysis conducted on geographies consisting of 378,572,642 people shows a moderate positive correlation between the proportion of Immigrants from Colombia and labor force participation rate among population between the ages 25 and 29 in the United States with a correlation coefficient (R) of 0.476 and weighted average of 84.7%, a difference of 0.050%.
In Labor Force | Age 25-29 Correlation Summary
| Measurement | Immigrants from England | Immigrants from Colombia |
| Minimum | 50.0% | 73.2% |
| Maximum | 100.0% | 100.0% |
| Range | 50.0% | 26.8% |
| Mean | 85.0% | 85.8% |
| Median | 86.8% | 85.3% |
| Interquartile 25% (IQ1) | 78.6% | 83.1% |
| Interquartile 75% (IQ3) | 100.0% | 87.0% |
| Interquartile Range (IQR) | 21.4% | 3.9% |
| Standard Deviation (Sample) | 13.7% | 5.4% |
| Standard Deviation (Population) | 13.6% | 5.3% |
Demographics Similar to Immigrants from England and Immigrants from Colombia by In Labor Force | Age 25-29
In terms of in labor force | age 25-29, the demographic groups most similar to Immigrants from England are Peruvian (84.7%, a difference of 0.0%), Swiss (84.7%, a difference of 0.0%), Immigrants from Asia (84.8%, a difference of 0.020%), Colombian (84.7%, a difference of 0.020%), and Immigrants from Pakistan (84.7%, a difference of 0.020%). Similarly, the demographic groups most similar to Immigrants from Colombia are Immigrants from Peru (84.7%, a difference of 0.0%), Canadian (84.7%, a difference of 0.0%), Argentinean (84.7%, a difference of 0.0%), Ghanaian (84.7%, a difference of 0.0%), and Immigrants from Ghana (84.7%, a difference of 0.010%).
| Demographics | Rating | Rank | In Labor Force | Age 25-29 |
| Immigrants | Senegal | 68.3 /100 | #145 | Good 84.8% |
| Icelanders | 68.2 /100 | #146 | Good 84.8% |
| Immigrants | Asia | 68.2 /100 | #147 | Good 84.8% |
| Immigrants | England | 65.2 /100 | #148 | Good 84.7% |
| Peruvians | 64.7 /100 | #149 | Good 84.7% |
| Swiss | 64.7 /100 | #150 | Good 84.7% |
| Colombians | 62.8 /100 | #151 | Good 84.7% |
| Immigrants | Pakistan | 62.7 /100 | #152 | Good 84.7% |
| Immigrants | Taiwan | 62.2 /100 | #153 | Good 84.7% |
| Immigrants | Sri Lanka | 61.7 /100 | #154 | Good 84.7% |
| Indians (Asian) | 61.6 /100 | #155 | Good 84.7% |
| French | 61.0 /100 | #156 | Good 84.7% |
| British | 60.4 /100 | #157 | Good 84.7% |
| Immigrants | Ghana | 60.2 /100 | #158 | Good 84.7% |
| Immigrants | Western Africa | 60.1 /100 | #159 | Good 84.7% |
| Immigrants | Peru | 58.6 /100 | #160 | Average 84.7% |
| Canadians | 58.5 /100 | #161 | Average 84.7% |
| Immigrants | Colombia | 58.3 /100 | #162 | Average 84.7% |
| Argentineans | 57.9 /100 | #163 | Average 84.7% |
| Ghanaians | 57.6 /100 | #164 | Average 84.7% |
| Immigrants | Burma/Myanmar | 57.4 /100 | #165 | Average 84.7% |