Immigrants from Micronesia vs Crow In Labor Force | Age 35-44
COMPARE
Immigrants from Micronesia
Crow
In Labor Force | Age 35-44
In Labor Force | Age 35-44 Comparison
Immigrants from Micronesia
Crow
83.1%
IN LABOR FORCE | AGE 35-44
0.0/ 100
METRIC RATING
279th/ 347
METRIC RANK
76.5%
IN LABOR FORCE | AGE 35-44
0.0/ 100
METRIC RATING
342nd/ 347
METRIC RANK
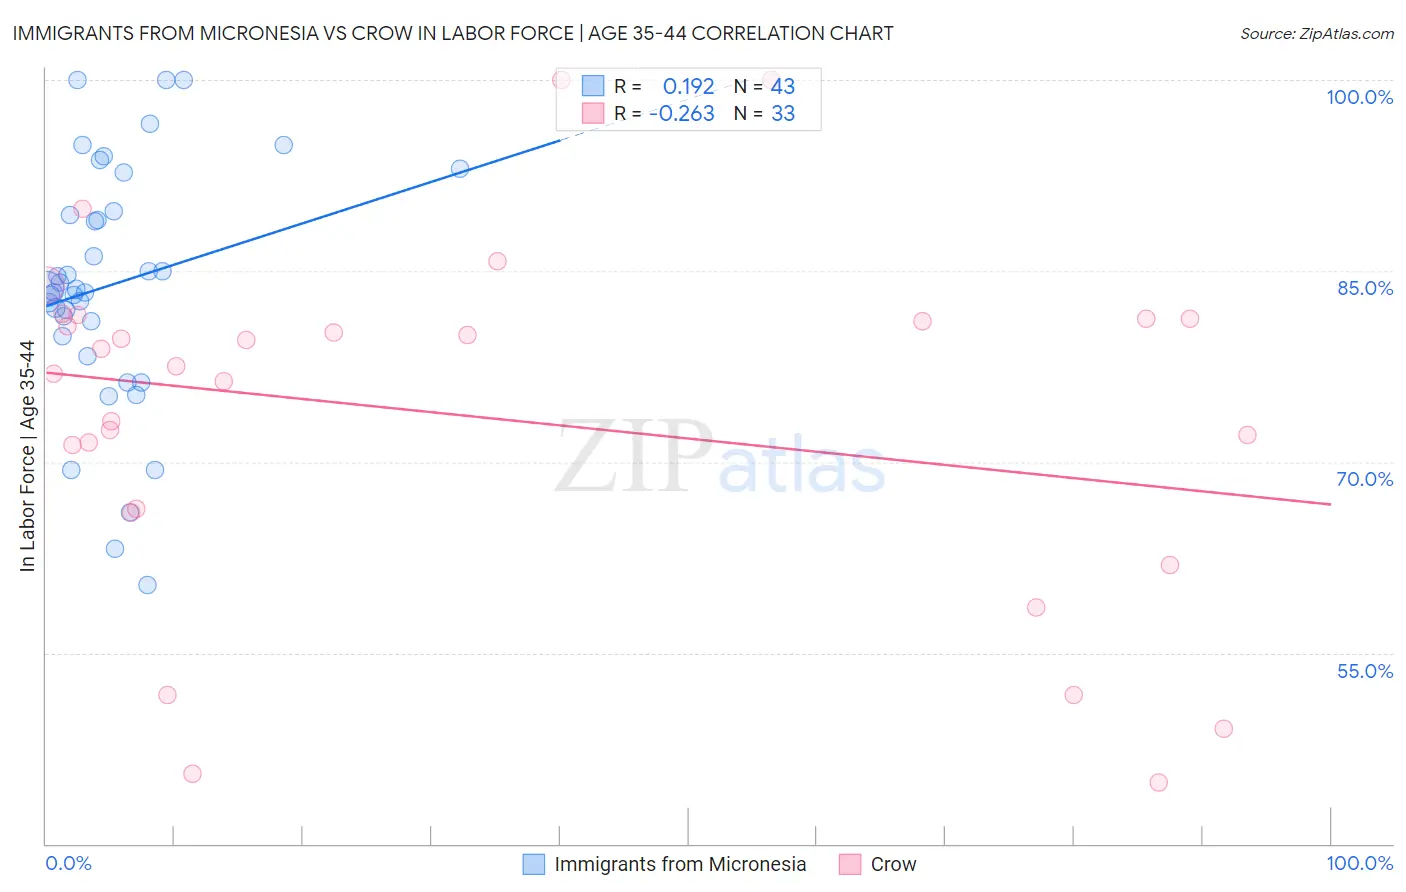
Immigrants from Micronesia vs Crow In Labor Force | Age 35-44 Correlation Chart
The statistical analysis conducted on geographies consisting of 61,600,178 people shows a poor positive correlation between the proportion of Immigrants from Micronesia and labor force participation rate among population between the ages 35 and 44 in the United States with a correlation coefficient (R) of 0.192 and weighted average of 83.1%. Similarly, the statistical analysis conducted on geographies consisting of 59,203,042 people shows a weak negative correlation between the proportion of Crow and labor force participation rate among population between the ages 35 and 44 in the United States with a correlation coefficient (R) of -0.263 and weighted average of 76.5%, a difference of 8.7%.
In Labor Force | Age 35-44 Correlation Summary
| Measurement | Immigrants from Micronesia | Crow |
| Minimum | 60.3% | 44.8% |
| Maximum | 100.0% | 100.0% |
| Range | 39.7% | 55.2% |
| Mean | 83.9% | 73.7% |
| Median | 83.6% | 77.5% |
| Interquartile 25% (IQ1) | 79.9% | 66.2% |
| Interquartile 75% (IQ3) | 89.7% | 81.2% |
| Interquartile Range (IQR) | 9.8% | 15.0% |
| Standard Deviation (Sample) | 9.4% | 13.9% |
| Standard Deviation (Population) | 9.3% | 13.7% |
Similar Demographics by In Labor Force | Age 35-44
Demographics Similar to Immigrants from Micronesia by In Labor Force | Age 35-44
In terms of in labor force | age 35-44, the demographic groups most similar to Immigrants from Micronesia are Belizean (83.1%, a difference of 0.010%), Dominican (83.1%, a difference of 0.040%), Samoan (83.2%, a difference of 0.080%), Delaware (83.2%, a difference of 0.090%), and Hawaiian (83.2%, a difference of 0.10%).
| Demographics | Rating | Rank | In Labor Force | Age 35-44 |
| Immigrants | Fiji | 0.0 /100 | #272 | Tragic 83.2% |
| Spanish | 0.0 /100 | #273 | Tragic 83.2% |
| Immigrants | Nonimmigrants | 0.0 /100 | #274 | Tragic 83.2% |
| Hawaiians | 0.0 /100 | #275 | Tragic 83.2% |
| Delaware | 0.0 /100 | #276 | Tragic 83.2% |
| Samoans | 0.0 /100 | #277 | Tragic 83.2% |
| Belizeans | 0.0 /100 | #278 | Tragic 83.1% |
| Immigrants | Micronesia | 0.0 /100 | #279 | Tragic 83.1% |
| Dominicans | 0.0 /100 | #280 | Tragic 83.1% |
| Guatemalans | 0.0 /100 | #281 | Tragic 83.0% |
| Osage | 0.0 /100 | #282 | Tragic 82.9% |
| Immigrants | Guatemala | 0.0 /100 | #283 | Tragic 82.9% |
| Immigrants | Dominican Republic | 0.0 /100 | #284 | Tragic 82.9% |
| Fijians | 0.0 /100 | #285 | Tragic 82.9% |
| Immigrants | Bangladesh | 0.0 /100 | #286 | Tragic 82.9% |
Demographics Similar to Crow by In Labor Force | Age 35-44
In terms of in labor force | age 35-44, the demographic groups most similar to Crow are Immigrants from Yemen (76.3%, a difference of 0.24%), Hopi (77.0%, a difference of 0.64%), Lumbee (77.0%, a difference of 0.69%), Yup'ik (77.3%, a difference of 1.0%), and Pueblo (77.4%, a difference of 1.1%).
| Demographics | Rating | Rank | In Labor Force | Age 35-44 |
| Kiowa | 0.0 /100 | #333 | Tragic 79.2% |
| Yakama | 0.0 /100 | #334 | Tragic 79.0% |
| Natives/Alaskans | 0.0 /100 | #335 | Tragic 78.9% |
| Arapaho | 0.0 /100 | #336 | Tragic 78.1% |
| Apache | 0.0 /100 | #337 | Tragic 77.9% |
| Pueblo | 0.0 /100 | #338 | Tragic 77.4% |
| Yup'ik | 0.0 /100 | #339 | Tragic 77.3% |
| Lumbee | 0.0 /100 | #340 | Tragic 77.0% |
| Hopi | 0.0 /100 | #341 | Tragic 77.0% |
| Crow | 0.0 /100 | #342 | Tragic 76.5% |
| Immigrants | Yemen | 0.0 /100 | #343 | Tragic 76.3% |
| Pima | 0.0 /100 | #344 | Tragic 74.8% |
| Yuman | 0.0 /100 | #345 | Tragic 74.7% |
| Tohono O'odham | 0.0 /100 | #346 | Tragic 74.1% |
| Navajo | 0.0 /100 | #347 | Tragic 73.8% |