Immigrants from Liberia vs Immigrants from Pakistan In Labor Force | Age 35-44
COMPARE
Immigrants from Liberia
Immigrants from Pakistan
In Labor Force | Age 35-44
In Labor Force | Age 35-44 Comparison
Immigrants from Liberia
Immigrants from Pakistan
85.4%
IN LABOR FORCE | AGE 35-44
99.9/ 100
METRIC RATING
26th/ 347
METRIC RANK
84.9%
IN LABOR FORCE | AGE 35-44
97.5/ 100
METRIC RATING
89th/ 347
METRIC RANK
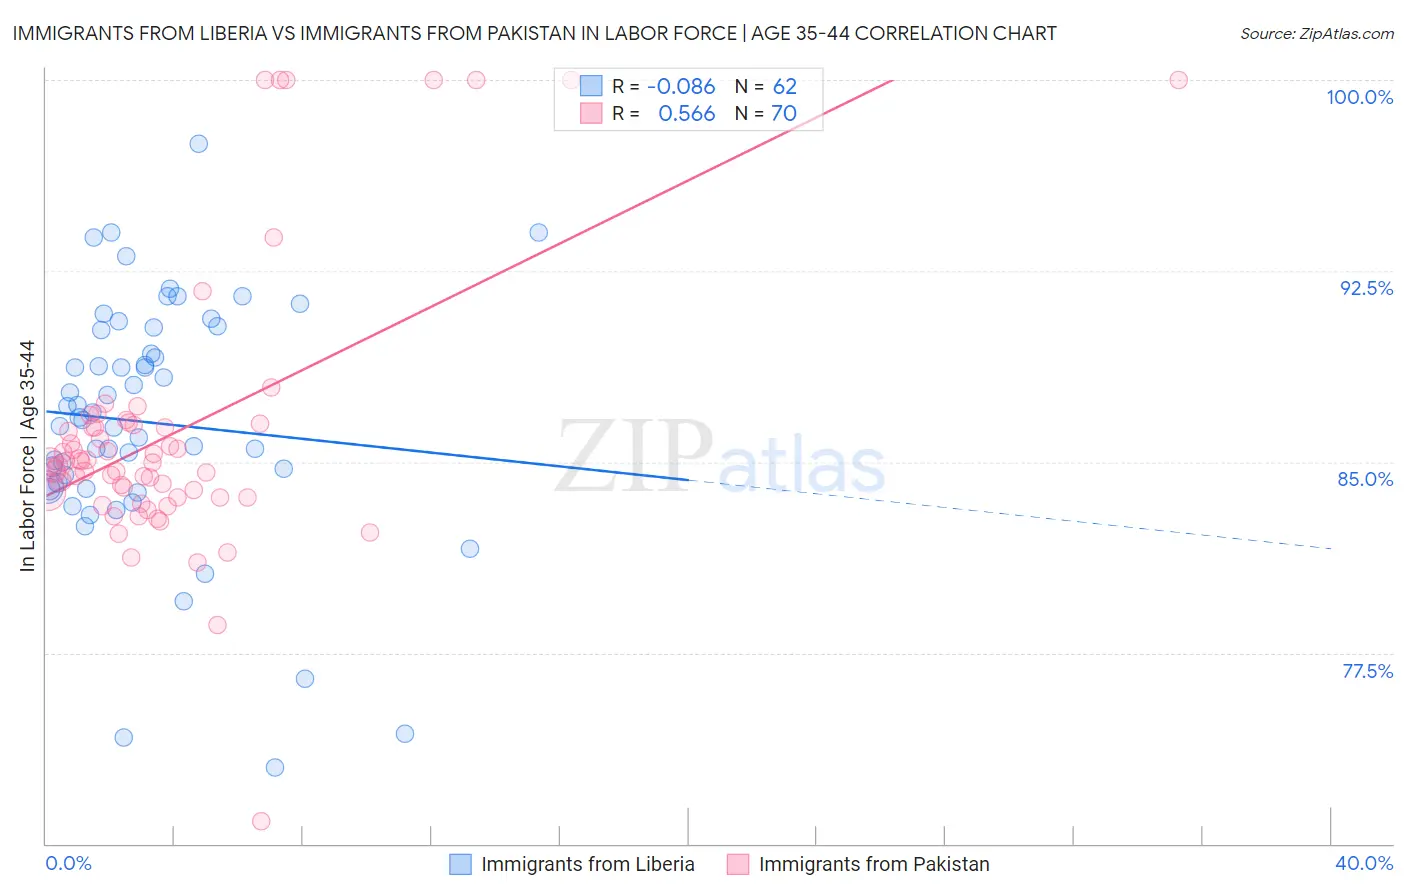
Immigrants from Liberia vs Immigrants from Pakistan In Labor Force | Age 35-44 Correlation Chart
The statistical analysis conducted on geographies consisting of 135,260,455 people shows a slight negative correlation between the proportion of Immigrants from Liberia and labor force participation rate among population between the ages 35 and 44 in the United States with a correlation coefficient (R) of -0.086 and weighted average of 85.4%. Similarly, the statistical analysis conducted on geographies consisting of 283,833,704 people shows a substantial positive correlation between the proportion of Immigrants from Pakistan and labor force participation rate among population between the ages 35 and 44 in the United States with a correlation coefficient (R) of 0.566 and weighted average of 84.9%, a difference of 0.58%.
In Labor Force | Age 35-44 Correlation Summary
| Measurement | Immigrants from Liberia | Immigrants from Pakistan |
| Minimum | 73.0% | 70.9% |
| Maximum | 97.5% | 100.0% |
| Range | 24.5% | 29.1% |
| Mean | 86.5% | 86.1% |
| Median | 86.7% | 85.0% |
| Interquartile 25% (IQ1) | 84.0% | 83.6% |
| Interquartile 75% (IQ3) | 90.2% | 86.4% |
| Interquartile Range (IQR) | 6.2% | 2.8% |
| Standard Deviation (Sample) | 4.8% | 5.4% |
| Standard Deviation (Population) | 4.8% | 5.3% |
Similar Demographics by In Labor Force | Age 35-44
Demographics Similar to Immigrants from Liberia by In Labor Force | Age 35-44
In terms of in labor force | age 35-44, the demographic groups most similar to Immigrants from Liberia are Paraguayan (85.4%, a difference of 0.0%), Immigrants from Lithuania (85.4%, a difference of 0.0%), Latvian (85.4%, a difference of 0.010%), Immigrants from Greece (85.3%, a difference of 0.020%), and Cambodian (85.3%, a difference of 0.050%).
| Demographics | Rating | Rank | In Labor Force | Age 35-44 |
| Slovenes | 100.0 /100 | #19 | Exceptional 85.6% |
| Immigrants | Serbia | 100.0 /100 | #20 | Exceptional 85.5% |
| Bulgarians | 100.0 /100 | #21 | Exceptional 85.5% |
| Immigrants | Bosnia and Herzegovina | 100.0 /100 | #22 | Exceptional 85.4% |
| Immigrants | Eastern Africa | 100.0 /100 | #23 | Exceptional 85.4% |
| Latvians | 99.9 /100 | #24 | Exceptional 85.4% |
| Paraguayans | 99.9 /100 | #25 | Exceptional 85.4% |
| Immigrants | Liberia | 99.9 /100 | #26 | Exceptional 85.4% |
| Immigrants | Lithuania | 99.9 /100 | #27 | Exceptional 85.4% |
| Immigrants | Greece | 99.9 /100 | #28 | Exceptional 85.3% |
| Cambodians | 99.9 /100 | #29 | Exceptional 85.3% |
| Bermudans | 99.9 /100 | #30 | Exceptional 85.3% |
| Czechs | 99.9 /100 | #31 | Exceptional 85.3% |
| Immigrants | India | 99.9 /100 | #32 | Exceptional 85.3% |
| Ugandans | 99.9 /100 | #33 | Exceptional 85.3% |
Demographics Similar to Immigrants from Pakistan by In Labor Force | Age 35-44
In terms of in labor force | age 35-44, the demographic groups most similar to Immigrants from Pakistan are Immigrants from France (84.9%, a difference of 0.0%), Senegalese (84.9%, a difference of 0.020%), Immigrants from Peru (84.9%, a difference of 0.020%), Immigrants from Middle Africa (84.9%, a difference of 0.020%), and Greek (84.9%, a difference of 0.020%).
| Demographics | Rating | Rank | In Labor Force | Age 35-44 |
| Immigrants | Sudan | 98.1 /100 | #82 | Exceptional 84.9% |
| Senegalese | 97.8 /100 | #83 | Exceptional 84.9% |
| Immigrants | Peru | 97.8 /100 | #84 | Exceptional 84.9% |
| Immigrants | Middle Africa | 97.8 /100 | #85 | Exceptional 84.9% |
| Greeks | 97.8 /100 | #86 | Exceptional 84.9% |
| Belgians | 97.7 /100 | #87 | Exceptional 84.9% |
| Yugoslavians | 97.7 /100 | #88 | Exceptional 84.9% |
| Immigrants | Pakistan | 97.5 /100 | #89 | Exceptional 84.9% |
| Immigrants | France | 97.4 /100 | #90 | Exceptional 84.9% |
| Immigrants | Europe | 97.2 /100 | #91 | Exceptional 84.9% |
| Ghanaians | 97.2 /100 | #92 | Exceptional 84.8% |
| Immigrants | Northern Africa | 97.1 /100 | #93 | Exceptional 84.8% |
| Mongolians | 96.8 /100 | #94 | Exceptional 84.8% |
| Immigrants | Kuwait | 96.7 /100 | #95 | Exceptional 84.8% |
| Cubans | 96.6 /100 | #96 | Exceptional 84.8% |