Immigrants from Nepal vs Immigrants from Oceania In Labor Force | Age 30-34
COMPARE
Immigrants from Nepal
Immigrants from Oceania
In Labor Force | Age 30-34
In Labor Force | Age 30-34 Comparison
Immigrants from Nepal
Immigrants from Oceania
85.6%
IN LABOR FORCE | AGE 30-34
99.8/ 100
METRIC RATING
45th/ 347
METRIC RANK
84.0%
IN LABOR FORCE | AGE 30-34
1.1/ 100
METRIC RATING
242nd/ 347
METRIC RANK
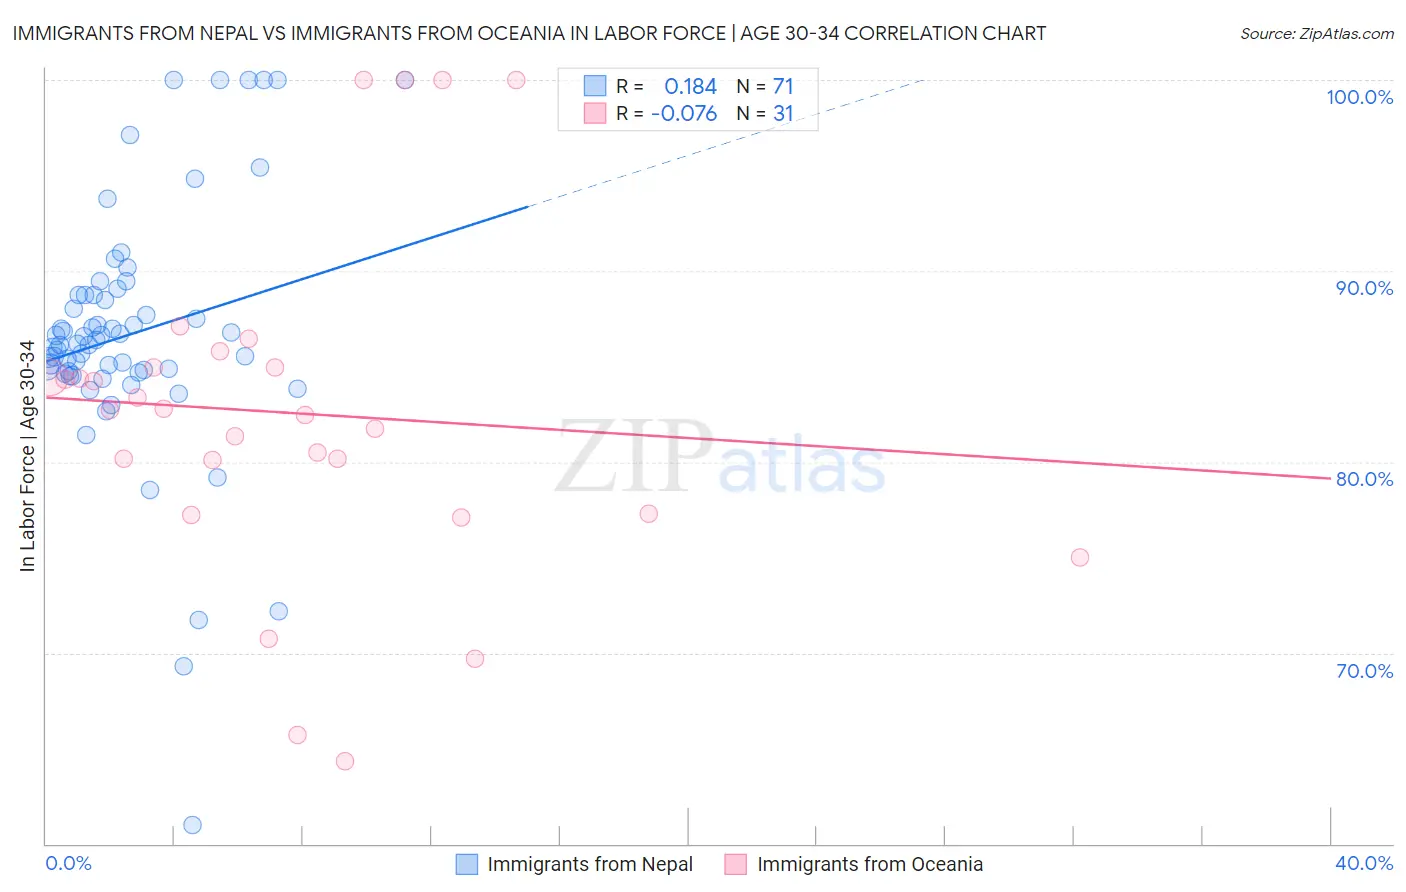
Immigrants from Nepal vs Immigrants from Oceania In Labor Force | Age 30-34 Correlation Chart
The statistical analysis conducted on geographies consisting of 186,729,132 people shows a poor positive correlation between the proportion of Immigrants from Nepal and labor force participation rate among population between the ages 30 and 34 in the United States with a correlation coefficient (R) of 0.184 and weighted average of 85.6%. Similarly, the statistical analysis conducted on geographies consisting of 305,403,957 people shows a slight negative correlation between the proportion of Immigrants from Oceania and labor force participation rate among population between the ages 30 and 34 in the United States with a correlation coefficient (R) of -0.076 and weighted average of 84.0%, a difference of 1.9%.
In Labor Force | Age 30-34 Correlation Summary
| Measurement | Immigrants from Nepal | Immigrants from Oceania |
| Minimum | 61.0% | 64.3% |
| Maximum | 100.0% | 100.0% |
| Range | 39.0% | 35.7% |
| Mean | 86.7% | 82.5% |
| Median | 86.2% | 82.7% |
| Interquartile 25% (IQ1) | 84.7% | 77.3% |
| Interquartile 75% (IQ3) | 88.7% | 84.9% |
| Interquartile Range (IQR) | 4.1% | 7.6% |
| Standard Deviation (Sample) | 6.7% | 8.9% |
| Standard Deviation (Population) | 6.6% | 8.8% |
Similar Demographics by In Labor Force | Age 30-34
Demographics Similar to Immigrants from Nepal by In Labor Force | Age 30-34
In terms of in labor force | age 30-34, the demographic groups most similar to Immigrants from Nepal are Immigrants from Sri Lanka (85.6%, a difference of 0.010%), Immigrants from Morocco (85.6%, a difference of 0.010%), Croatian (85.6%, a difference of 0.010%), Immigrants from Lithuania (85.6%, a difference of 0.030%), and Immigrants from Sweden (85.6%, a difference of 0.030%).
| Demographics | Rating | Rank | In Labor Force | Age 30-34 |
| Immigrants | Greece | 99.9 /100 | #38 | Exceptional 85.7% |
| Eastern Europeans | 99.9 /100 | #39 | Exceptional 85.7% |
| Turks | 99.9 /100 | #40 | Exceptional 85.7% |
| Immigrants | Italy | 99.9 /100 | #41 | Exceptional 85.7% |
| Zimbabweans | 99.8 /100 | #42 | Exceptional 85.6% |
| Immigrants | Lithuania | 99.8 /100 | #43 | Exceptional 85.6% |
| Immigrants | Sri Lanka | 99.8 /100 | #44 | Exceptional 85.6% |
| Immigrants | Nepal | 99.8 /100 | #45 | Exceptional 85.6% |
| Immigrants | Morocco | 99.8 /100 | #46 | Exceptional 85.6% |
| Croatians | 99.8 /100 | #47 | Exceptional 85.6% |
| Immigrants | Sweden | 99.8 /100 | #48 | Exceptional 85.6% |
| Lithuanians | 99.8 /100 | #49 | Exceptional 85.6% |
| Immigrants | Australia | 99.8 /100 | #50 | Exceptional 85.6% |
| Cape Verdeans | 99.7 /100 | #51 | Exceptional 85.6% |
| Slovenes | 99.7 /100 | #52 | Exceptional 85.6% |
Demographics Similar to Immigrants from Oceania by In Labor Force | Age 30-34
In terms of in labor force | age 30-34, the demographic groups most similar to Immigrants from Oceania are Immigrants from Portugal (84.0%, a difference of 0.010%), Immigrants from Caribbean (84.0%, a difference of 0.010%), English (84.0%, a difference of 0.030%), Venezuelan (84.0%, a difference of 0.030%), and Celtic (84.1%, a difference of 0.040%).
| Demographics | Rating | Rank | In Labor Force | Age 30-34 |
| French American Indians | 1.7 /100 | #235 | Tragic 84.1% |
| U.S. Virgin Islanders | 1.5 /100 | #236 | Tragic 84.1% |
| Celtics | 1.4 /100 | #237 | Tragic 84.1% |
| Immigrants | Barbados | 1.4 /100 | #238 | Tragic 84.0% |
| English | 1.4 /100 | #239 | Tragic 84.0% |
| Venezuelans | 1.3 /100 | #240 | Tragic 84.0% |
| Immigrants | Portugal | 1.2 /100 | #241 | Tragic 84.0% |
| Immigrants | Oceania | 1.1 /100 | #242 | Tragic 84.0% |
| Immigrants | Caribbean | 1.1 /100 | #243 | Tragic 84.0% |
| Basques | 0.9 /100 | #244 | Tragic 84.0% |
| Immigrants | Venezuela | 0.9 /100 | #245 | Tragic 84.0% |
| Central Americans | 0.9 /100 | #246 | Tragic 84.0% |
| British West Indians | 0.8 /100 | #247 | Tragic 84.0% |
| Portuguese | 0.8 /100 | #248 | Tragic 84.0% |
| Immigrants | Dominica | 0.7 /100 | #249 | Tragic 84.0% |