Immigrants from Lebanon vs Alaska Native In Labor Force | Age 20-24
COMPARE
Immigrants from Lebanon
Alaska Native
In Labor Force | Age 20-24
In Labor Force | Age 20-24 Comparison
Immigrants from Lebanon
Alaska Natives
73.1%
IN LABOR FORCE | AGE 20-24
0.1/ 100
METRIC RATING
286th/ 347
METRIC RANK
75.9%
IN LABOR FORCE | AGE 20-24
95.1/ 100
METRIC RATING
115th/ 347
METRIC RANK
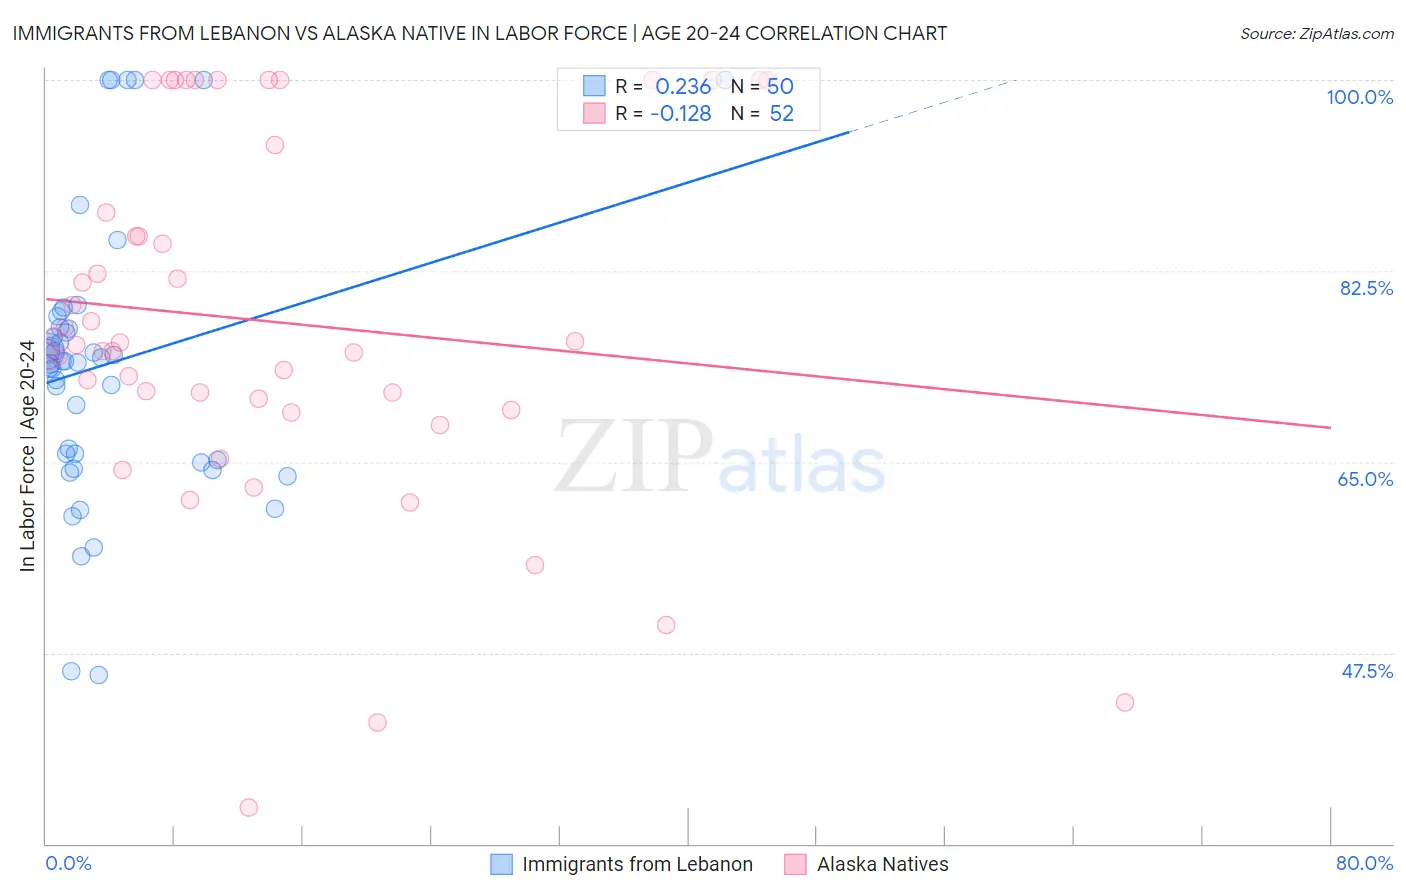
Immigrants from Lebanon vs Alaska Native In Labor Force | Age 20-24 Correlation Chart
The statistical analysis conducted on geographies consisting of 217,133,124 people shows a weak positive correlation between the proportion of Immigrants from Lebanon and labor force participation rate among population between the ages 20 and 24 in the United States with a correlation coefficient (R) of 0.236 and weighted average of 73.1%. Similarly, the statistical analysis conducted on geographies consisting of 76,758,773 people shows a poor negative correlation between the proportion of Alaska Natives and labor force participation rate among population between the ages 20 and 24 in the United States with a correlation coefficient (R) of -0.128 and weighted average of 75.9%, a difference of 3.7%.
In Labor Force | Age 20-24 Correlation Summary
| Measurement | Immigrants from Lebanon | Alaska Native |
| Minimum | 45.4% | 33.3% |
| Maximum | 100.0% | 100.0% |
| Range | 54.6% | 66.7% |
| Mean | 74.0% | 77.8% |
| Median | 74.2% | 75.8% |
| Interquartile 25% (IQ1) | 65.2% | 70.3% |
| Interquartile 75% (IQ3) | 77.3% | 90.9% |
| Interquartile Range (IQR) | 12.1% | 20.7% |
| Standard Deviation (Sample) | 12.8% | 16.5% |
| Standard Deviation (Population) | 12.7% | 16.4% |
Similar Demographics by In Labor Force | Age 20-24
Demographics Similar to Immigrants from Lebanon by In Labor Force | Age 20-24
In terms of in labor force | age 20-24, the demographic groups most similar to Immigrants from Lebanon are Immigrants from Korea (73.1%, a difference of 0.020%), Nicaraguan (73.2%, a difference of 0.030%), Kiowa (73.2%, a difference of 0.090%), Argentinean (73.1%, a difference of 0.10%), and Immigrants from Bahamas (73.2%, a difference of 0.11%).
| Demographics | Rating | Rank | In Labor Force | Age 20-24 |
| Venezuelans | 0.2 /100 | #279 | Tragic 73.3% |
| Bahamians | 0.1 /100 | #280 | Tragic 73.3% |
| Immigrants | Venezuela | 0.1 /100 | #281 | Tragic 73.2% |
| Immigrants | Spain | 0.1 /100 | #282 | Tragic 73.2% |
| Immigrants | Bahamas | 0.1 /100 | #283 | Tragic 73.2% |
| Kiowa | 0.1 /100 | #284 | Tragic 73.2% |
| Nicaraguans | 0.1 /100 | #285 | Tragic 73.2% |
| Immigrants | Lebanon | 0.1 /100 | #286 | Tragic 73.1% |
| Immigrants | Korea | 0.1 /100 | #287 | Tragic 73.1% |
| Argentineans | 0.1 /100 | #288 | Tragic 73.1% |
| U.S. Virgin Islanders | 0.1 /100 | #289 | Tragic 73.0% |
| Immigrants | Belarus | 0.1 /100 | #290 | Tragic 73.0% |
| Immigrants | Nicaragua | 0.0 /100 | #291 | Tragic 72.9% |
| Pueblo | 0.0 /100 | #292 | Tragic 72.9% |
| Immigrants | Belize | 0.0 /100 | #293 | Tragic 72.8% |
Demographics Similar to Alaska Natives by In Labor Force | Age 20-24
In terms of in labor force | age 20-24, the demographic groups most similar to Alaska Natives are Immigrants from Zimbabwe (75.9%, a difference of 0.0%), Immigrants from Netherlands (75.9%, a difference of 0.010%), Immigrants from North America (75.9%, a difference of 0.010%), Assyrian/Chaldean/Syriac (75.9%, a difference of 0.010%), and Spanish American (75.8%, a difference of 0.020%).
| Demographics | Rating | Rank | In Labor Force | Age 20-24 |
| Iraqis | 96.6 /100 | #108 | Exceptional 76.0% |
| Cherokee | 95.8 /100 | #109 | Exceptional 75.9% |
| Immigrants | Morocco | 95.8 /100 | #110 | Exceptional 75.9% |
| Ukrainians | 95.7 /100 | #111 | Exceptional 75.9% |
| Immigrants | Canada | 95.6 /100 | #112 | Exceptional 75.9% |
| Immigrants | Netherlands | 95.3 /100 | #113 | Exceptional 75.9% |
| Immigrants | Zimbabwe | 95.1 /100 | #114 | Exceptional 75.9% |
| Alaska Natives | 95.1 /100 | #115 | Exceptional 75.9% |
| Immigrants | North America | 95.0 /100 | #116 | Exceptional 75.9% |
| Assyrians/Chaldeans/Syriacs | 94.9 /100 | #117 | Exceptional 75.9% |
| Spanish Americans | 94.8 /100 | #118 | Exceptional 75.8% |
| Immigrants | Portugal | 94.8 /100 | #119 | Exceptional 75.8% |
| Immigrants | Africa | 94.6 /100 | #120 | Exceptional 75.8% |
| Immigrants | Serbia | 94.3 /100 | #121 | Exceptional 75.8% |
| Pakistanis | 94.1 /100 | #122 | Exceptional 75.8% |