Immigrants from Lebanon vs Austrian In Labor Force | Age 20-64
COMPARE
Immigrants from Lebanon
Austrian
In Labor Force | Age 20-64
In Labor Force | Age 20-64 Comparison
Immigrants from Lebanon
Austrians
78.7%
IN LABOR FORCE | AGE 20-64
0.5/ 100
METRIC RATING
254th/ 347
METRIC RANK
79.7%
IN LABOR FORCE | AGE 20-64
67.6/ 100
METRIC RATING
158th/ 347
METRIC RANK
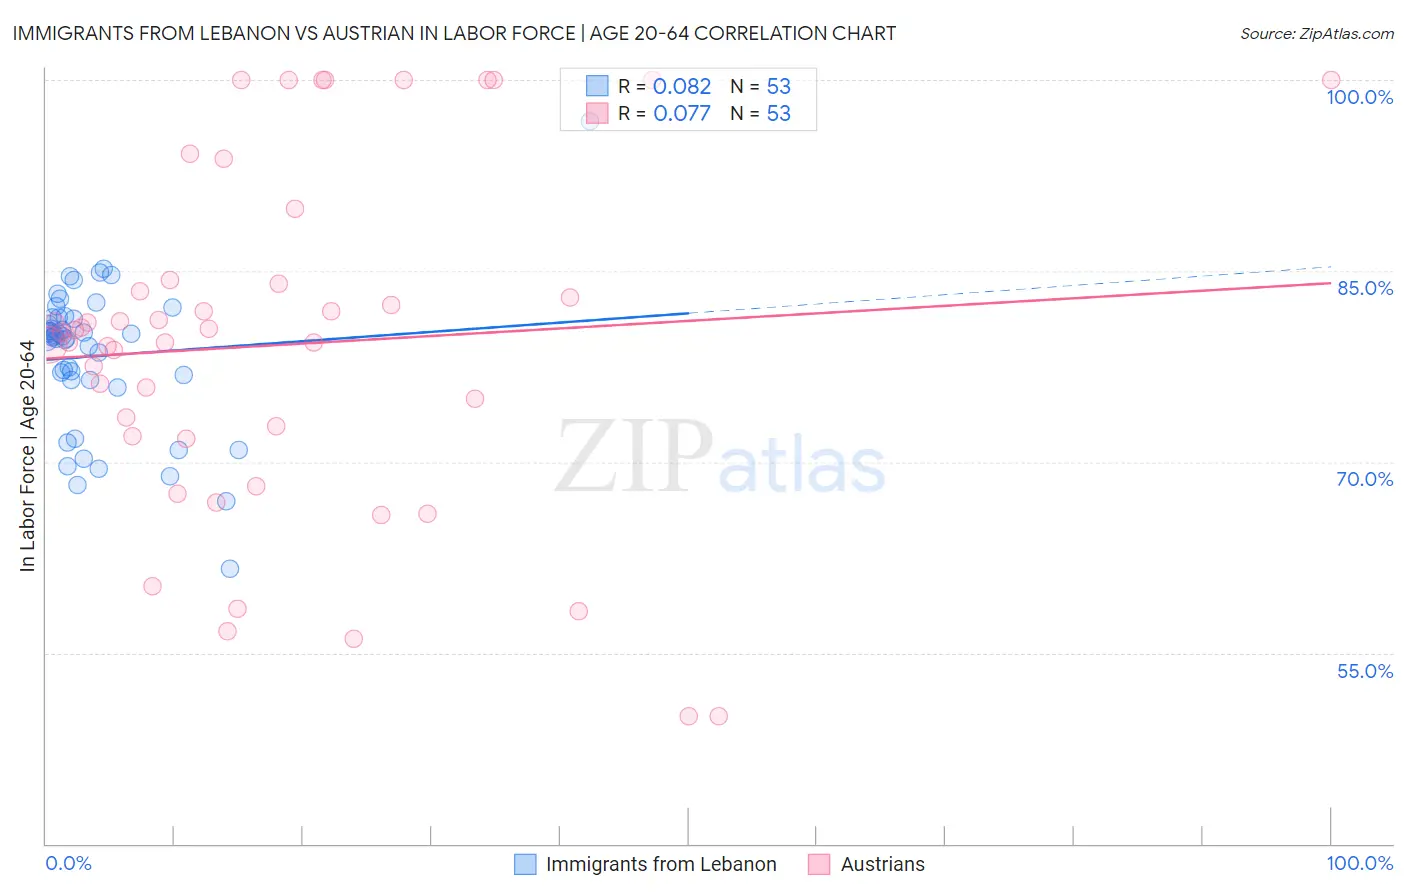
Immigrants from Lebanon vs Austrian In Labor Force | Age 20-64 Correlation Chart
The statistical analysis conducted on geographies consisting of 217,153,550 people shows a slight positive correlation between the proportion of Immigrants from Lebanon and labor force participation rate among population between the ages 20 and 64 in the United States with a correlation coefficient (R) of 0.082 and weighted average of 78.7%. Similarly, the statistical analysis conducted on geographies consisting of 452,086,784 people shows a slight positive correlation between the proportion of Austrians and labor force participation rate among population between the ages 20 and 64 in the United States with a correlation coefficient (R) of 0.077 and weighted average of 79.7%, a difference of 1.2%.
In Labor Force | Age 20-64 Correlation Summary
| Measurement | Immigrants from Lebanon | Austrian |
| Minimum | 61.6% | 50.0% |
| Maximum | 96.8% | 100.0% |
| Range | 35.2% | 50.0% |
| Mean | 78.3% | 79.2% |
| Median | 79.8% | 80.2% |
| Interquartile 25% (IQ1) | 76.4% | 71.9% |
| Interquartile 75% (IQ3) | 81.4% | 84.2% |
| Interquartile Range (IQR) | 5.0% | 12.3% |
| Standard Deviation (Sample) | 5.8% | 13.5% |
| Standard Deviation (Population) | 5.8% | 13.4% |
Similar Demographics by In Labor Force | Age 20-64
Demographics Similar to Immigrants from Lebanon by In Labor Force | Age 20-64
In terms of in labor force | age 20-64, the demographic groups most similar to Immigrants from Lebanon are Basque (78.7%, a difference of 0.0%), Immigrants from Honduras (78.7%, a difference of 0.010%), Hawaiian (78.7%, a difference of 0.020%), Celtic (78.7%, a difference of 0.020%), and Guatemalan (78.7%, a difference of 0.040%).
| Demographics | Rating | Rank | In Labor Force | Age 20-64 |
| Immigrants | Germany | 1.0 /100 | #247 | Tragic 78.8% |
| Immigrants | Caribbean | 1.0 /100 | #248 | Tragic 78.8% |
| English | 0.9 /100 | #249 | Tragic 78.8% |
| Hondurans | 0.8 /100 | #250 | Tragic 78.8% |
| Barbadians | 0.7 /100 | #251 | Tragic 78.8% |
| Immigrants | Honduras | 0.6 /100 | #252 | Tragic 78.7% |
| Basques | 0.5 /100 | #253 | Tragic 78.7% |
| Immigrants | Lebanon | 0.5 /100 | #254 | Tragic 78.7% |
| Hawaiians | 0.5 /100 | #255 | Tragic 78.7% |
| Celtics | 0.5 /100 | #256 | Tragic 78.7% |
| Guatemalans | 0.4 /100 | #257 | Tragic 78.7% |
| Immigrants | Guatemala | 0.4 /100 | #258 | Tragic 78.7% |
| Tsimshian | 0.4 /100 | #259 | Tragic 78.7% |
| Immigrants | Fiji | 0.3 /100 | #260 | Tragic 78.6% |
| Whites/Caucasians | 0.2 /100 | #261 | Tragic 78.5% |
Demographics Similar to Austrians by In Labor Force | Age 20-64
In terms of in labor force | age 20-64, the demographic groups most similar to Austrians are Immigrants from South Africa (79.7%, a difference of 0.010%), Senegalese (79.7%, a difference of 0.010%), Immigrants from China (79.7%, a difference of 0.010%), Immigrants from Cuba (79.7%, a difference of 0.010%), and Moroccan (79.7%, a difference of 0.010%).
| Demographics | Rating | Rank | In Labor Force | Age 20-64 |
| Scandinavians | 72.0 /100 | #151 | Good 79.7% |
| Immigrants | Northern Europe | 72.0 /100 | #152 | Good 79.7% |
| Immigrants | Kazakhstan | 69.5 /100 | #153 | Good 79.7% |
| New Zealanders | 69.4 /100 | #154 | Good 79.7% |
| Immigrants | South Africa | 69.2 /100 | #155 | Good 79.7% |
| Senegalese | 69.1 /100 | #156 | Good 79.7% |
| Immigrants | China | 69.1 /100 | #157 | Good 79.7% |
| Austrians | 67.6 /100 | #158 | Good 79.7% |
| Immigrants | Cuba | 66.7 /100 | #159 | Good 79.7% |
| Moroccans | 66.7 /100 | #160 | Good 79.7% |
| South Africans | 66.2 /100 | #161 | Good 79.7% |
| Germans | 65.2 /100 | #162 | Good 79.7% |
| Immigrants | Costa Rica | 64.6 /100 | #163 | Good 79.7% |
| Immigrants | Burma/Myanmar | 64.4 /100 | #164 | Good 79.7% |
| Nigerians | 64.0 /100 | #165 | Good 79.7% |