Immigrants from Lebanon vs Immigrants from Jordan In Labor Force | Age 20-64
COMPARE
Immigrants from Lebanon
Immigrants from Jordan
In Labor Force | Age 20-64
In Labor Force | Age 20-64 Comparison
Immigrants from Lebanon
Immigrants from Jordan
78.7%
IN LABOR FORCE | AGE 20-64
0.5/ 100
METRIC RATING
254th/ 347
METRIC RANK
80.0%
IN LABOR FORCE | AGE 20-64
94.8/ 100
METRIC RATING
107th/ 347
METRIC RANK
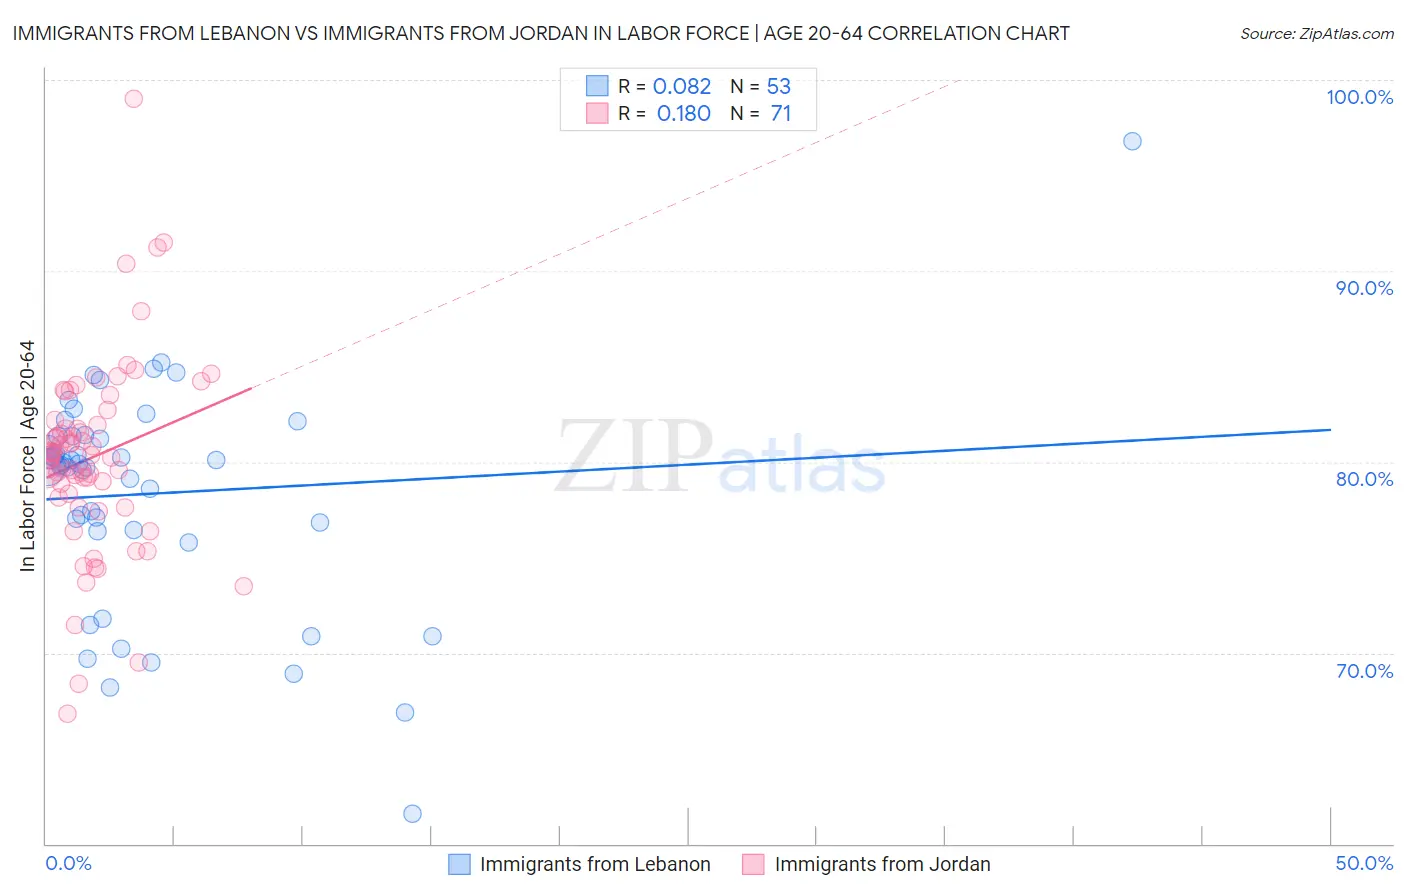
Immigrants from Lebanon vs Immigrants from Jordan In Labor Force | Age 20-64 Correlation Chart
The statistical analysis conducted on geographies consisting of 217,153,550 people shows a slight positive correlation between the proportion of Immigrants from Lebanon and labor force participation rate among population between the ages 20 and 64 in the United States with a correlation coefficient (R) of 0.082 and weighted average of 78.7%. Similarly, the statistical analysis conducted on geographies consisting of 181,282,289 people shows a poor positive correlation between the proportion of Immigrants from Jordan and labor force participation rate among population between the ages 20 and 64 in the United States with a correlation coefficient (R) of 0.180 and weighted average of 80.0%, a difference of 1.7%.
In Labor Force | Age 20-64 Correlation Summary
| Measurement | Immigrants from Lebanon | Immigrants from Jordan |
| Minimum | 61.6% | 66.8% |
| Maximum | 96.8% | 99.0% |
| Range | 35.2% | 32.2% |
| Mean | 78.3% | 80.2% |
| Median | 79.8% | 80.3% |
| Interquartile 25% (IQ1) | 76.4% | 78.2% |
| Interquartile 75% (IQ3) | 81.4% | 82.2% |
| Interquartile Range (IQR) | 5.0% | 4.0% |
| Standard Deviation (Sample) | 5.8% | 5.1% |
| Standard Deviation (Population) | 5.8% | 5.1% |
Similar Demographics by In Labor Force | Age 20-64
Demographics Similar to Immigrants from Lebanon by In Labor Force | Age 20-64
In terms of in labor force | age 20-64, the demographic groups most similar to Immigrants from Lebanon are Basque (78.7%, a difference of 0.0%), Immigrants from Honduras (78.7%, a difference of 0.010%), Hawaiian (78.7%, a difference of 0.020%), Celtic (78.7%, a difference of 0.020%), and Guatemalan (78.7%, a difference of 0.040%).
| Demographics | Rating | Rank | In Labor Force | Age 20-64 |
| Immigrants | Germany | 1.0 /100 | #247 | Tragic 78.8% |
| Immigrants | Caribbean | 1.0 /100 | #248 | Tragic 78.8% |
| English | 0.9 /100 | #249 | Tragic 78.8% |
| Hondurans | 0.8 /100 | #250 | Tragic 78.8% |
| Barbadians | 0.7 /100 | #251 | Tragic 78.8% |
| Immigrants | Honduras | 0.6 /100 | #252 | Tragic 78.7% |
| Basques | 0.5 /100 | #253 | Tragic 78.7% |
| Immigrants | Lebanon | 0.5 /100 | #254 | Tragic 78.7% |
| Hawaiians | 0.5 /100 | #255 | Tragic 78.7% |
| Celtics | 0.5 /100 | #256 | Tragic 78.7% |
| Guatemalans | 0.4 /100 | #257 | Tragic 78.7% |
| Immigrants | Guatemala | 0.4 /100 | #258 | Tragic 78.7% |
| Tsimshian | 0.4 /100 | #259 | Tragic 78.7% |
| Immigrants | Fiji | 0.3 /100 | #260 | Tragic 78.6% |
| Whites/Caucasians | 0.2 /100 | #261 | Tragic 78.5% |
Demographics Similar to Immigrants from Jordan by In Labor Force | Age 20-64
In terms of in labor force | age 20-64, the demographic groups most similar to Immigrants from Jordan are Greek (80.0%, a difference of 0.0%), Immigrants from Ghana (80.0%, a difference of 0.010%), Venezuelan (80.0%, a difference of 0.020%), Iranian (80.0%, a difference of 0.020%), and Filipino (80.1%, a difference of 0.030%).
| Demographics | Rating | Rank | In Labor Force | Age 20-64 |
| Filipinos | 95.6 /100 | #100 | Exceptional 80.1% |
| Palestinians | 95.5 /100 | #101 | Exceptional 80.0% |
| Immigrants | Australia | 95.5 /100 | #102 | Exceptional 80.0% |
| Russians | 95.5 /100 | #103 | Exceptional 80.0% |
| Venezuelans | 95.3 /100 | #104 | Exceptional 80.0% |
| Immigrants | Ghana | 95.0 /100 | #105 | Exceptional 80.0% |
| Greeks | 94.8 /100 | #106 | Exceptional 80.0% |
| Immigrants | Jordan | 94.8 /100 | #107 | Exceptional 80.0% |
| Iranians | 94.3 /100 | #108 | Exceptional 80.0% |
| Immigrants | Argentina | 94.1 /100 | #109 | Exceptional 80.0% |
| Estonians | 94.0 /100 | #110 | Exceptional 80.0% |
| Immigrants | South America | 93.9 /100 | #111 | Exceptional 80.0% |
| Immigrants | Italy | 93.9 /100 | #112 | Exceptional 80.0% |
| Sri Lankans | 93.9 /100 | #113 | Exceptional 80.0% |
| Argentineans | 93.8 /100 | #114 | Exceptional 80.0% |