Immigrants from Venezuela vs Jordanian In Labor Force | Age 30-34
COMPARE
Immigrants from Venezuela
Jordanian
In Labor Force | Age 30-34
In Labor Force | Age 30-34 Comparison
Immigrants from Venezuela
Jordanians
84.0%
IN LABOR FORCE | AGE 30-34
0.9/ 100
METRIC RATING
245th/ 347
METRIC RANK
85.0%
IN LABOR FORCE | AGE 30-34
88.6/ 100
METRIC RATING
136th/ 347
METRIC RANK
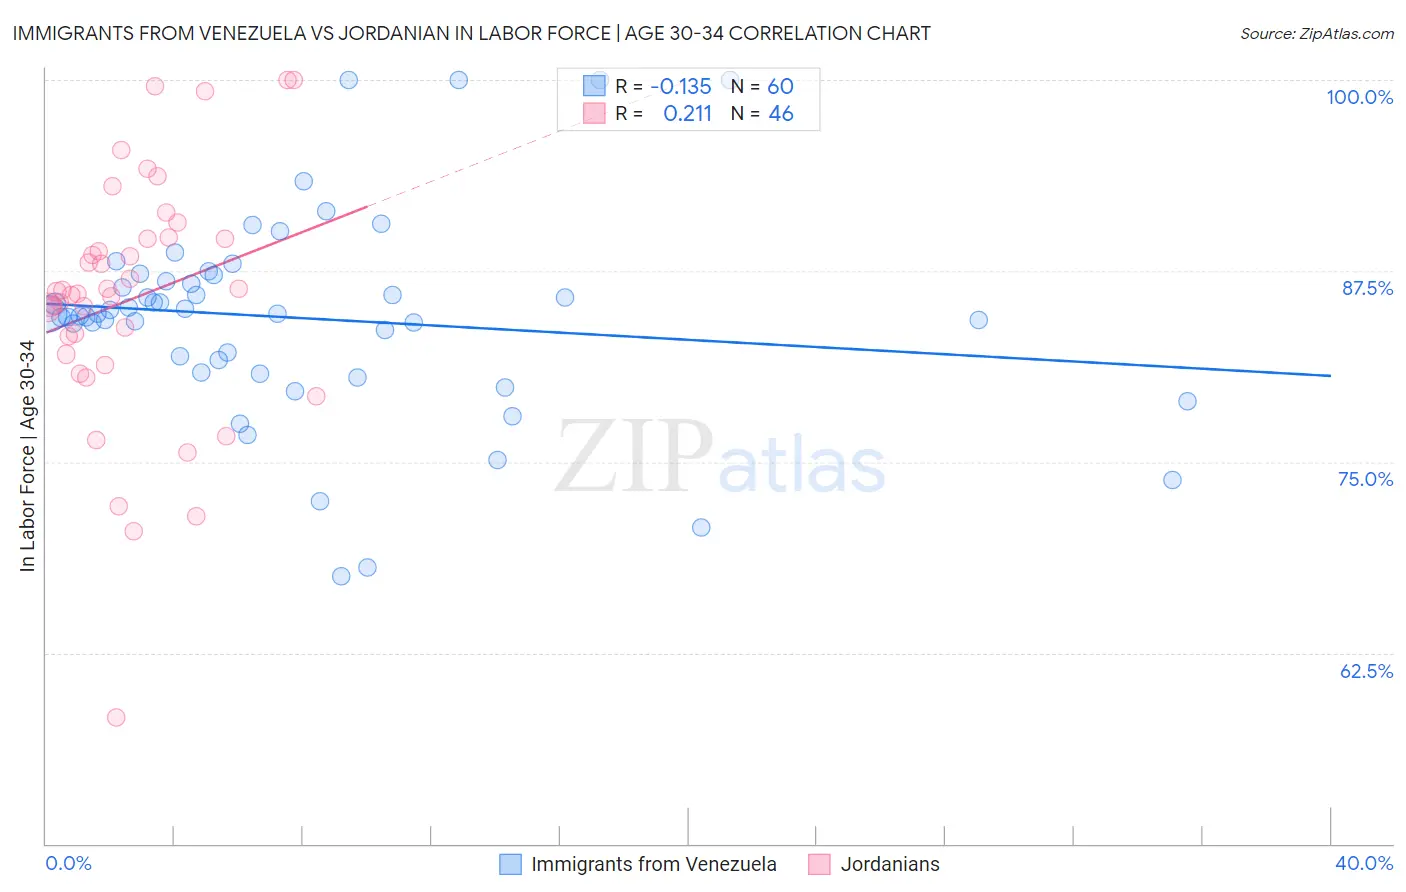
Immigrants from Venezuela vs Jordanian In Labor Force | Age 30-34 Correlation Chart
The statistical analysis conducted on geographies consisting of 287,808,791 people shows a poor negative correlation between the proportion of Immigrants from Venezuela and labor force participation rate among population between the ages 30 and 34 in the United States with a correlation coefficient (R) of -0.135 and weighted average of 84.0%. Similarly, the statistical analysis conducted on geographies consisting of 166,400,430 people shows a weak positive correlation between the proportion of Jordanians and labor force participation rate among population between the ages 30 and 34 in the United States with a correlation coefficient (R) of 0.211 and weighted average of 85.0%, a difference of 1.2%.
In Labor Force | Age 30-34 Correlation Summary
| Measurement | Immigrants from Venezuela | Jordanian |
| Minimum | 67.5% | 58.3% |
| Maximum | 100.0% | 100.0% |
| Range | 32.5% | 41.7% |
| Mean | 84.4% | 85.6% |
| Median | 84.7% | 86.1% |
| Interquartile 25% (IQ1) | 81.3% | 82.0% |
| Interquartile 75% (IQ3) | 87.1% | 89.6% |
| Interquartile Range (IQR) | 5.8% | 7.6% |
| Standard Deviation (Sample) | 6.7% | 8.2% |
| Standard Deviation (Population) | 6.7% | 8.1% |
Similar Demographics by In Labor Force | Age 30-34
Demographics Similar to Immigrants from Venezuela by In Labor Force | Age 30-34
In terms of in labor force | age 30-34, the demographic groups most similar to Immigrants from Venezuela are Basque (84.0%, a difference of 0.0%), Central American (84.0%, a difference of 0.0%), British West Indian (84.0%, a difference of 0.020%), Immigrants from Caribbean (84.0%, a difference of 0.030%), and Portuguese (84.0%, a difference of 0.030%).
| Demographics | Rating | Rank | In Labor Force | Age 30-34 |
| Immigrants | Barbados | 1.4 /100 | #238 | Tragic 84.0% |
| English | 1.4 /100 | #239 | Tragic 84.0% |
| Venezuelans | 1.3 /100 | #240 | Tragic 84.0% |
| Immigrants | Portugal | 1.2 /100 | #241 | Tragic 84.0% |
| Immigrants | Oceania | 1.1 /100 | #242 | Tragic 84.0% |
| Immigrants | Caribbean | 1.1 /100 | #243 | Tragic 84.0% |
| Basques | 0.9 /100 | #244 | Tragic 84.0% |
| Immigrants | Venezuela | 0.9 /100 | #245 | Tragic 84.0% |
| Central Americans | 0.9 /100 | #246 | Tragic 84.0% |
| British West Indians | 0.8 /100 | #247 | Tragic 84.0% |
| Portuguese | 0.8 /100 | #248 | Tragic 84.0% |
| Immigrants | Dominica | 0.7 /100 | #249 | Tragic 84.0% |
| Immigrants | Iraq | 0.7 /100 | #250 | Tragic 83.9% |
| Nicaraguans | 0.6 /100 | #251 | Tragic 83.9% |
| Bahamians | 0.6 /100 | #252 | Tragic 83.9% |
Demographics Similar to Jordanians by In Labor Force | Age 30-34
In terms of in labor force | age 30-34, the demographic groups most similar to Jordanians are Immigrants from Chile (85.0%, a difference of 0.010%), Immigrants from Asia (85.0%, a difference of 0.010%), South African (85.0%, a difference of 0.010%), Sri Lankan (85.0%, a difference of 0.010%), and Chinese (85.0%, a difference of 0.020%).
| Demographics | Rating | Rank | In Labor Force | Age 30-34 |
| Immigrants | Western Africa | 90.2 /100 | #129 | Exceptional 85.0% |
| Immigrants | Spain | 90.0 /100 | #130 | Exceptional 85.0% |
| Chinese | 89.6 /100 | #131 | Excellent 85.0% |
| Immigrants | Israel | 89.5 /100 | #132 | Excellent 85.0% |
| New Zealanders | 89.5 /100 | #133 | Excellent 85.0% |
| Immigrants | Chile | 89.2 /100 | #134 | Excellent 85.0% |
| Immigrants | Asia | 88.9 /100 | #135 | Excellent 85.0% |
| Jordanians | 88.6 /100 | #136 | Excellent 85.0% |
| South Africans | 88.0 /100 | #137 | Excellent 85.0% |
| Sri Lankans | 87.8 /100 | #138 | Excellent 85.0% |
| Bhutanese | 87.5 /100 | #139 | Excellent 85.0% |
| Immigrants | Vietnam | 86.5 /100 | #140 | Excellent 85.0% |
| Chileans | 85.3 /100 | #141 | Excellent 84.9% |
| Immigrants | Indonesia | 84.3 /100 | #142 | Excellent 84.9% |
| Colombians | 82.2 /100 | #143 | Excellent 84.9% |