Immigrants from Latvia vs Immigrants from Iraq In Labor Force | Age 16-19
COMPARE
Immigrants from Latvia
Immigrants from Iraq
In Labor Force | Age 16-19
In Labor Force | Age 16-19 Comparison
Immigrants from Latvia
Immigrants from Iraq
36.8%
IN LABOR FORCE | AGE 16-19
61.6/ 100
METRIC RATING
169th/ 347
METRIC RANK
39.4%
IN LABOR FORCE | AGE 16-19
99.8/ 100
METRIC RATING
80th/ 347
METRIC RANK
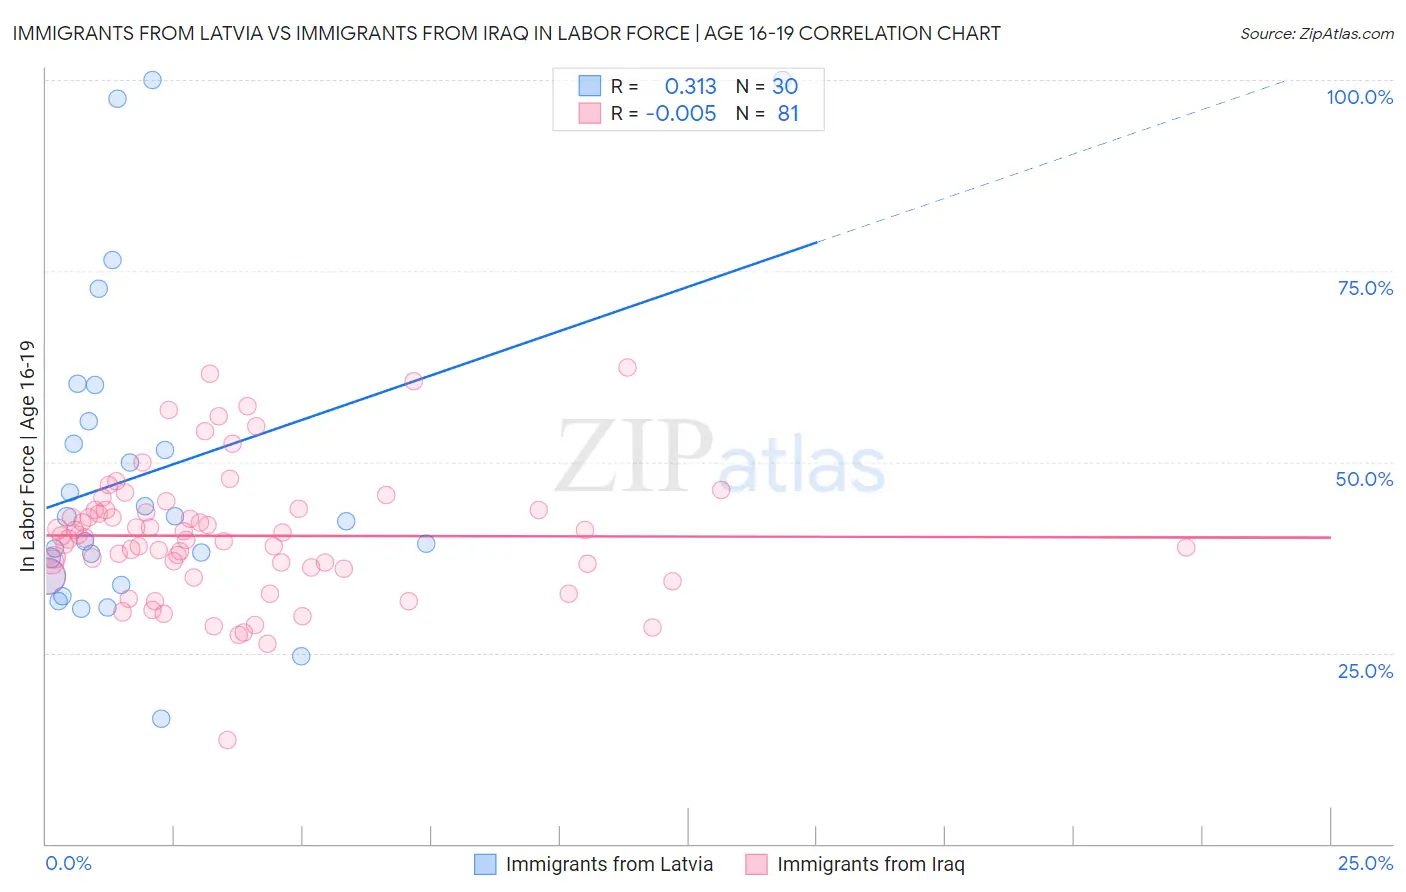
Immigrants from Latvia vs Immigrants from Iraq In Labor Force | Age 16-19 Correlation Chart
The statistical analysis conducted on geographies consisting of 113,686,535 people shows a mild positive correlation between the proportion of Immigrants from Latvia and labor force participation rate among population between the ages 16 and 19 in the United States with a correlation coefficient (R) of 0.313 and weighted average of 36.8%. Similarly, the statistical analysis conducted on geographies consisting of 194,717,275 people shows no correlation between the proportion of Immigrants from Iraq and labor force participation rate among population between the ages 16 and 19 in the United States with a correlation coefficient (R) of -0.005 and weighted average of 39.4%, a difference of 7.1%.
In Labor Force | Age 16-19 Correlation Summary
| Measurement | Immigrants from Latvia | Immigrants from Iraq |
| Minimum | 16.4% | 13.6% |
| Maximum | 100.0% | 62.4% |
| Range | 83.6% | 48.8% |
| Mean | 48.7% | 40.3% |
| Median | 42.6% | 40.0% |
| Interquartile 25% (IQ1) | 35.0% | 36.1% |
| Interquartile 75% (IQ3) | 55.3% | 43.7% |
| Interquartile Range (IQR) | 20.3% | 7.6% |
| Standard Deviation (Sample) | 21.4% | 8.5% |
| Standard Deviation (Population) | 21.1% | 8.5% |
Similar Demographics by In Labor Force | Age 16-19
Demographics Similar to Immigrants from Latvia by In Labor Force | Age 16-19
In terms of in labor force | age 16-19, the demographic groups most similar to Immigrants from Latvia are Immigrants from South Africa (36.8%, a difference of 0.060%), Palestinian (36.8%, a difference of 0.080%), Arab (36.8%, a difference of 0.11%), Immigrants from Cambodia (36.7%, a difference of 0.17%), and South African (36.7%, a difference of 0.17%).
| Demographics | Rating | Rank | In Labor Force | Age 16-19 |
| Immigrants | Jordan | 69.5 /100 | #162 | Good 36.9% |
| Bermudans | 69.3 /100 | #163 | Good 36.9% |
| Immigrants | Kuwait | 68.9 /100 | #164 | Good 36.9% |
| Yakama | 66.9 /100 | #165 | Good 36.9% |
| Immigrants | Western Africa | 66.7 /100 | #166 | Good 36.9% |
| Arabs | 63.6 /100 | #167 | Good 36.8% |
| Palestinians | 63.1 /100 | #168 | Good 36.8% |
| Immigrants | Latvia | 61.6 /100 | #169 | Good 36.8% |
| Immigrants | South Africa | 60.5 /100 | #170 | Good 36.8% |
| Immigrants | Cambodia | 58.4 /100 | #171 | Average 36.7% |
| South Africans | 58.3 /100 | #172 | Average 36.7% |
| Russians | 57.5 /100 | #173 | Average 36.7% |
| Immigrants | Czechoslovakia | 50.0 /100 | #174 | Average 36.6% |
| Natives/Alaskans | 49.0 /100 | #175 | Average 36.6% |
| Albanians | 48.8 /100 | #176 | Average 36.5% |
Demographics Similar to Immigrants from Iraq by In Labor Force | Age 16-19
In terms of in labor force | age 16-19, the demographic groups most similar to Immigrants from Iraq are Marshallese (39.5%, a difference of 0.18%), Shoshone (39.3%, a difference of 0.28%), Austrian (39.5%, a difference of 0.31%), Basque (39.3%, a difference of 0.34%), and Spanish (39.3%, a difference of 0.36%).
| Demographics | Rating | Rank | In Labor Force | Age 16-19 |
| Immigrants | Middle Africa | 99.9 /100 | #73 | Exceptional 39.9% |
| Hungarians | 99.9 /100 | #74 | Exceptional 39.8% |
| French American Indians | 99.9 /100 | #75 | Exceptional 39.8% |
| Malaysians | 99.9 /100 | #76 | Exceptional 39.7% |
| Immigrants | Portugal | 99.9 /100 | #77 | Exceptional 39.7% |
| Austrians | 99.8 /100 | #78 | Exceptional 39.5% |
| Marshallese | 99.8 /100 | #79 | Exceptional 39.5% |
| Immigrants | Iraq | 99.8 /100 | #80 | Exceptional 39.4% |
| Shoshone | 99.7 /100 | #81 | Exceptional 39.3% |
| Basques | 99.7 /100 | #82 | Exceptional 39.3% |
| Spanish | 99.7 /100 | #83 | Exceptional 39.3% |
| Immigrants | Uganda | 99.7 /100 | #84 | Exceptional 39.2% |
| Creek | 99.6 /100 | #85 | Exceptional 39.1% |
| Samoans | 99.6 /100 | #86 | Exceptional 39.1% |
| Immigrants | Germany | 99.6 /100 | #87 | Exceptional 39.1% |