Ethiopian vs Immigrants from Japan In Labor Force | Age 45-54
COMPARE
Ethiopian
Immigrants from Japan
In Labor Force | Age 45-54
In Labor Force | Age 45-54 Comparison
Ethiopians
Immigrants from Japan
84.8%
IN LABOR FORCE | AGE 45-54
100.0/ 100
METRIC RATING
5th/ 347
METRIC RANK
83.3%
IN LABOR FORCE | AGE 45-54
95.5/ 100
METRIC RATING
90th/ 347
METRIC RANK
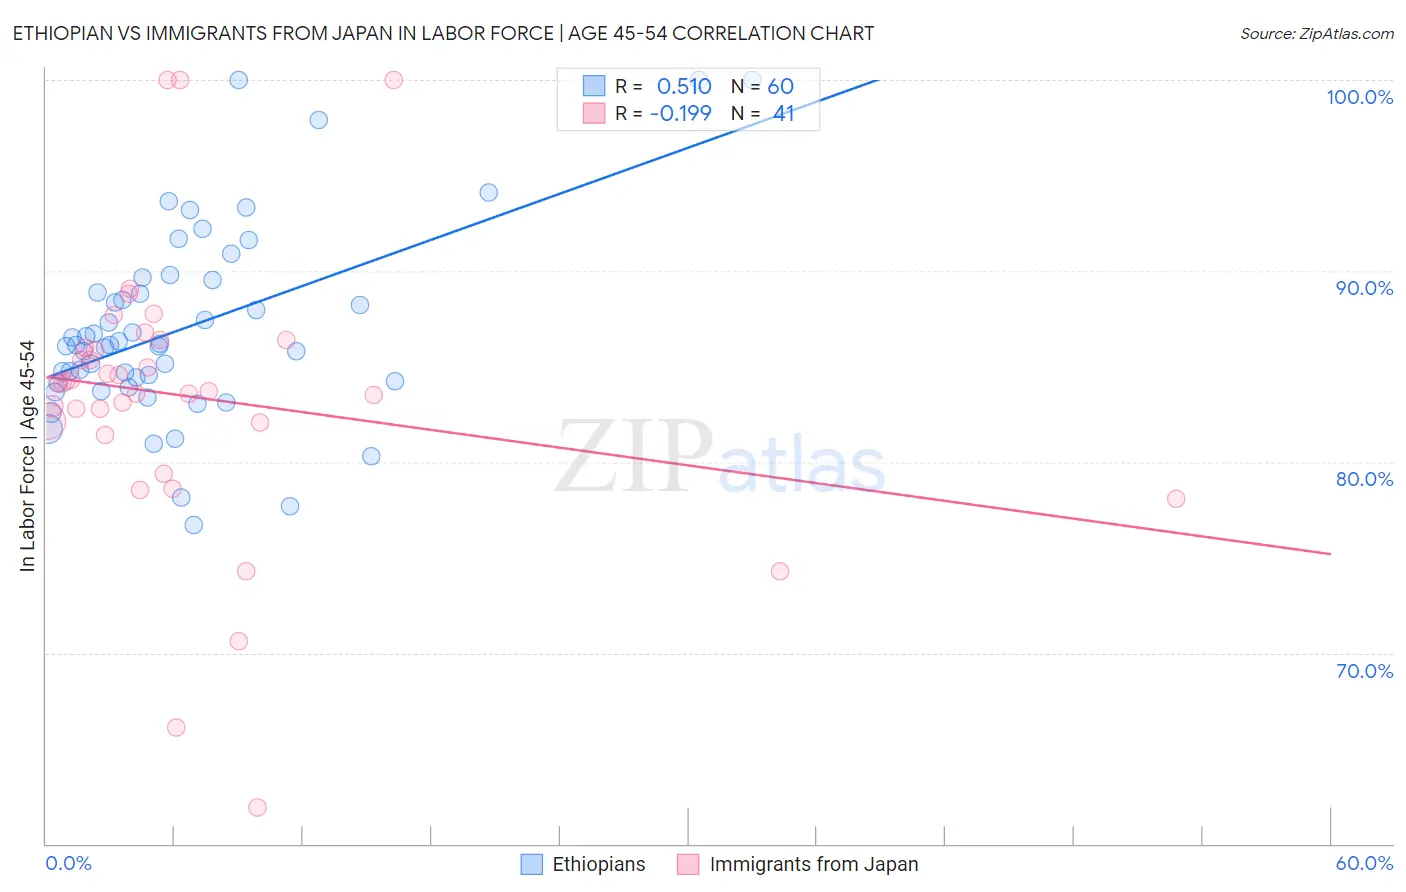
Ethiopian vs Immigrants from Japan In Labor Force | Age 45-54 Correlation Chart
The statistical analysis conducted on geographies consisting of 223,081,675 people shows a substantial positive correlation between the proportion of Ethiopians and labor force participation rate among population between the ages 45 and 54 in the United States with a correlation coefficient (R) of 0.510 and weighted average of 84.8%. Similarly, the statistical analysis conducted on geographies consisting of 339,969,041 people shows a poor negative correlation between the proportion of Immigrants from Japan and labor force participation rate among population between the ages 45 and 54 in the United States with a correlation coefficient (R) of -0.199 and weighted average of 83.3%, a difference of 1.7%.
In Labor Force | Age 45-54 Correlation Summary
| Measurement | Ethiopian | Immigrants from Japan |
| Minimum | 76.7% | 61.9% |
| Maximum | 100.0% | 100.0% |
| Range | 23.3% | 38.1% |
| Mean | 87.0% | 83.4% |
| Median | 86.1% | 84.1% |
| Interquartile 25% (IQ1) | 84.2% | 81.7% |
| Interquartile 75% (IQ3) | 89.2% | 86.2% |
| Interquartile Range (IQR) | 5.0% | 4.4% |
| Standard Deviation (Sample) | 5.0% | 7.4% |
| Standard Deviation (Population) | 5.0% | 7.3% |
Similar Demographics by In Labor Force | Age 45-54
Demographics Similar to Ethiopians by In Labor Force | Age 45-54
In terms of in labor force | age 45-54, the demographic groups most similar to Ethiopians are Immigrants from Ethiopia (84.8%, a difference of 0.080%), Immigrants from India (84.7%, a difference of 0.11%), Immigrants from Cameroon (84.6%, a difference of 0.18%), Bolivian (84.9%, a difference of 0.20%), and Luxembourger (85.0%, a difference of 0.29%).
| Demographics | Rating | Rank | In Labor Force | Age 45-54 |
| Immigrants | Bolivia | 100.0 /100 | #1 | Exceptional 85.3% |
| Luxembourgers | 100.0 /100 | #2 | Exceptional 85.0% |
| Bolivians | 100.0 /100 | #3 | Exceptional 84.9% |
| Immigrants | Ethiopia | 100.0 /100 | #4 | Exceptional 84.8% |
| Ethiopians | 100.0 /100 | #5 | Exceptional 84.8% |
| Immigrants | India | 100.0 /100 | #6 | Exceptional 84.7% |
| Immigrants | Cameroon | 100.0 /100 | #7 | Exceptional 84.6% |
| Sierra Leoneans | 100.0 /100 | #8 | Exceptional 84.5% |
| Immigrants | Sierra Leone | 100.0 /100 | #9 | Exceptional 84.4% |
| Norwegians | 100.0 /100 | #10 | Exceptional 84.4% |
| Thais | 100.0 /100 | #11 | Exceptional 84.3% |
| Bulgarians | 100.0 /100 | #12 | Exceptional 84.2% |
| Chinese | 99.9 /100 | #13 | Exceptional 84.1% |
| Cambodians | 99.9 /100 | #14 | Exceptional 84.1% |
| Cypriots | 99.9 /100 | #15 | Exceptional 84.1% |
Demographics Similar to Immigrants from Japan by In Labor Force | Age 45-54
In terms of in labor force | age 45-54, the demographic groups most similar to Immigrants from Japan are Immigrants from Eastern Europe (83.3%, a difference of 0.0%), Immigrants from Asia (83.3%, a difference of 0.0%), Indian (Asian) (83.3%, a difference of 0.0%), South American (83.3%, a difference of 0.0%), and Immigrants from Northern Africa (83.3%, a difference of 0.010%).
| Demographics | Rating | Rank | In Labor Force | Age 45-54 |
| Immigrants | Zimbabwe | 96.3 /100 | #83 | Exceptional 83.4% |
| Immigrants | Bosnia and Herzegovina | 96.0 /100 | #84 | Exceptional 83.3% |
| Greeks | 95.9 /100 | #85 | Exceptional 83.3% |
| Immigrants | Northern Africa | 95.7 /100 | #86 | Exceptional 83.3% |
| Immigrants | Eastern Europe | 95.6 /100 | #87 | Exceptional 83.3% |
| Immigrants | Asia | 95.6 /100 | #88 | Exceptional 83.3% |
| Indians (Asian) | 95.5 /100 | #89 | Exceptional 83.3% |
| Immigrants | Japan | 95.5 /100 | #90 | Exceptional 83.3% |
| South Americans | 95.5 /100 | #91 | Exceptional 83.3% |
| Danes | 95.3 /100 | #92 | Exceptional 83.3% |
| Italians | 95.1 /100 | #93 | Exceptional 83.3% |
| Argentineans | 94.9 /100 | #94 | Exceptional 83.3% |
| Immigrants | Argentina | 94.9 /100 | #95 | Exceptional 83.3% |
| Immigrants | Kuwait | 94.8 /100 | #96 | Exceptional 83.3% |
| Palestinians | 94.8 /100 | #97 | Exceptional 83.3% |