Immigrants from Kazakhstan vs Immigrants from Serbia In Labor Force | Age 16-19
COMPARE
Immigrants from Kazakhstan
Immigrants from Serbia
In Labor Force | Age 16-19
In Labor Force | Age 16-19 Comparison
Immigrants from Kazakhstan
Immigrants from Serbia
35.2%
IN LABOR FORCE | AGE 16-19
4.5/ 100
METRIC RATING
232nd/ 347
METRIC RANK
36.0%
IN LABOR FORCE | AGE 16-19
21.0/ 100
METRIC RATING
197th/ 347
METRIC RANK
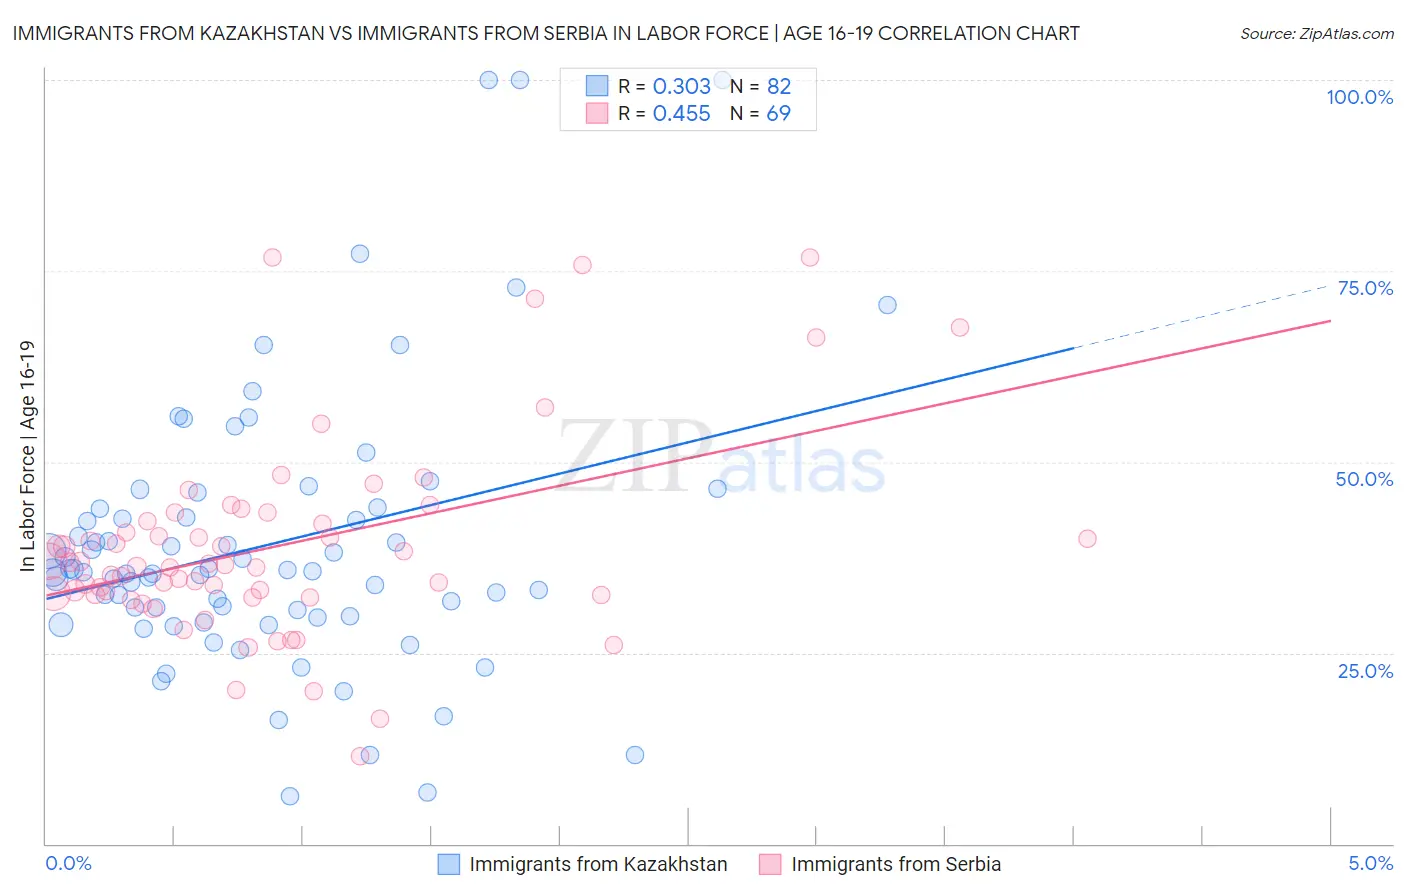
Immigrants from Kazakhstan vs Immigrants from Serbia In Labor Force | Age 16-19 Correlation Chart
The statistical analysis conducted on geographies consisting of 124,390,900 people shows a mild positive correlation between the proportion of Immigrants from Kazakhstan and labor force participation rate among population between the ages 16 and 19 in the United States with a correlation coefficient (R) of 0.303 and weighted average of 35.2%. Similarly, the statistical analysis conducted on geographies consisting of 131,679,358 people shows a moderate positive correlation between the proportion of Immigrants from Serbia and labor force participation rate among population between the ages 16 and 19 in the United States with a correlation coefficient (R) of 0.455 and weighted average of 36.0%, a difference of 2.3%.
In Labor Force | Age 16-19 Correlation Summary
| Measurement | Immigrants from Kazakhstan | Immigrants from Serbia |
| Minimum | 6.2% | 11.5% |
| Maximum | 100.0% | 76.8% |
| Range | 93.8% | 65.3% |
| Mean | 39.1% | 39.0% |
| Median | 35.6% | 36.5% |
| Interquartile 25% (IQ1) | 29.8% | 32.6% |
| Interquartile 75% (IQ3) | 43.9% | 42.8% |
| Interquartile Range (IQR) | 14.1% | 10.2% |
| Standard Deviation (Sample) | 18.0% | 13.1% |
| Standard Deviation (Population) | 17.9% | 13.0% |
Similar Demographics by In Labor Force | Age 16-19
Demographics Similar to Immigrants from Kazakhstan by In Labor Force | Age 16-19
In terms of in labor force | age 16-19, the demographic groups most similar to Immigrants from Kazakhstan are Immigrants from Syria (35.2%, a difference of 0.0%), Immigrants from France (35.1%, a difference of 0.040%), Immigrants from Mexico (35.1%, a difference of 0.080%), Immigrants from Honduras (35.2%, a difference of 0.12%), and Immigrants from Lebanon (35.2%, a difference of 0.16%).
| Demographics | Rating | Rank | In Labor Force | Age 16-19 |
| Immigrants | Belgium | 6.1 /100 | #225 | Tragic 35.3% |
| Immigrants | Guatemala | 5.7 /100 | #226 | Tragic 35.3% |
| Mongolians | 5.7 /100 | #227 | Tragic 35.3% |
| Immigrants | Senegal | 5.5 /100 | #228 | Tragic 35.3% |
| Immigrants | Lebanon | 5.0 /100 | #229 | Tragic 35.2% |
| Immigrants | Honduras | 4.9 /100 | #230 | Tragic 35.2% |
| Immigrants | Syria | 4.5 /100 | #231 | Tragic 35.2% |
| Immigrants | Kazakhstan | 4.5 /100 | #232 | Tragic 35.2% |
| Immigrants | France | 4.3 /100 | #233 | Tragic 35.1% |
| Immigrants | Mexico | 4.2 /100 | #234 | Tragic 35.1% |
| Immigrants | Philippines | 4.0 /100 | #235 | Tragic 35.1% |
| Immigrants | Australia | 3.6 /100 | #236 | Tragic 35.1% |
| Immigrants | India | 3.5 /100 | #237 | Tragic 35.0% |
| Immigrants | Vietnam | 3.4 /100 | #238 | Tragic 35.0% |
| Inupiat | 3.2 /100 | #239 | Tragic 35.0% |
Demographics Similar to Immigrants from Serbia by In Labor Force | Age 16-19
In terms of in labor force | age 16-19, the demographic groups most similar to Immigrants from Serbia are Mexican American Indian (36.0%, a difference of 0.010%), Immigrants from Northern Africa (35.9%, a difference of 0.080%), Immigrants from Norway (35.9%, a difference of 0.090%), Bolivian (36.0%, a difference of 0.17%), and Immigrants from Sweden (35.9%, a difference of 0.17%).
| Demographics | Rating | Rank | In Labor Force | Age 16-19 |
| Panamanians | 28.6 /100 | #190 | Fair 36.1% |
| Immigrants | Croatia | 27.5 /100 | #191 | Fair 36.1% |
| Afghans | 25.7 /100 | #192 | Fair 36.1% |
| Immigrants | Denmark | 25.0 /100 | #193 | Fair 36.1% |
| Nigerians | 24.6 /100 | #194 | Fair 36.1% |
| Bolivians | 23.3 /100 | #195 | Fair 36.0% |
| Mexican American Indians | 21.1 /100 | #196 | Fair 36.0% |
| Immigrants | Serbia | 21.0 /100 | #197 | Fair 36.0% |
| Immigrants | Northern Africa | 19.9 /100 | #198 | Poor 35.9% |
| Immigrants | Norway | 19.8 /100 | #199 | Poor 35.9% |
| Immigrants | Sweden | 18.8 /100 | #200 | Poor 35.9% |
| Alsatians | 17.5 /100 | #201 | Poor 35.9% |
| Senegalese | 17.4 /100 | #202 | Poor 35.9% |
| Immigrants | Nigeria | 16.8 /100 | #203 | Poor 35.8% |
| Immigrants | Albania | 15.0 /100 | #204 | Poor 35.8% |