Immigrants from Kazakhstan vs Immigrants from Cabo Verde In Labor Force | Age 16-19
COMPARE
Immigrants from Kazakhstan
Immigrants from Cabo Verde
In Labor Force | Age 16-19
In Labor Force | Age 16-19 Comparison
Immigrants from Kazakhstan
Immigrants from Cabo Verde
35.2%
IN LABOR FORCE | AGE 16-19
4.5/ 100
METRIC RATING
232nd/ 347
METRIC RANK
44.7%
IN LABOR FORCE | AGE 16-19
100.0/ 100
METRIC RATING
8th/ 347
METRIC RANK
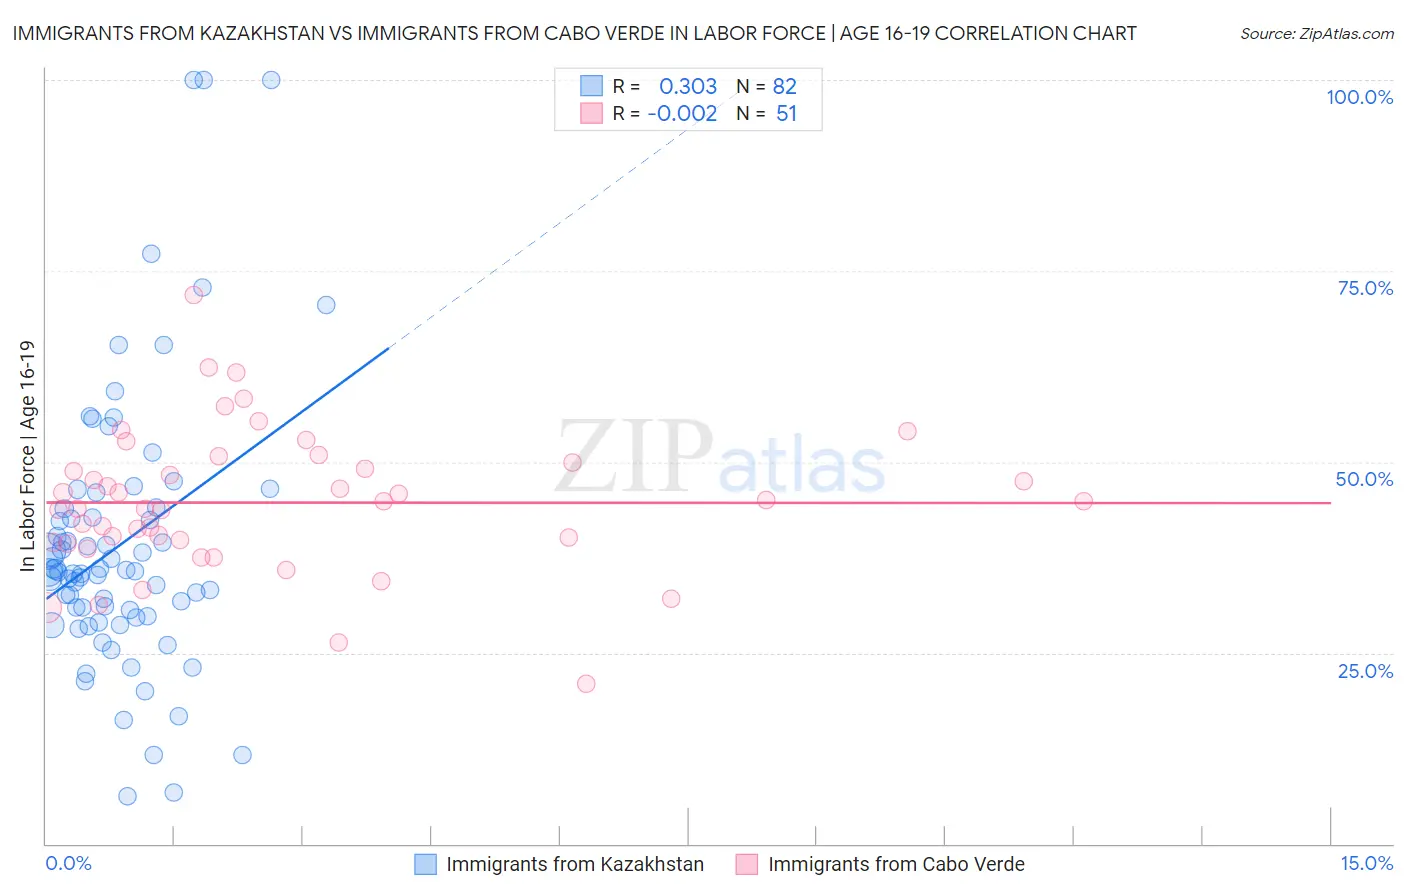
Immigrants from Kazakhstan vs Immigrants from Cabo Verde In Labor Force | Age 16-19 Correlation Chart
The statistical analysis conducted on geographies consisting of 124,390,900 people shows a mild positive correlation between the proportion of Immigrants from Kazakhstan and labor force participation rate among population between the ages 16 and 19 in the United States with a correlation coefficient (R) of 0.303 and weighted average of 35.2%. Similarly, the statistical analysis conducted on geographies consisting of 38,150,273 people shows no correlation between the proportion of Immigrants from Cabo Verde and labor force participation rate among population between the ages 16 and 19 in the United States with a correlation coefficient (R) of -0.002 and weighted average of 44.7%, a difference of 27.1%.
In Labor Force | Age 16-19 Correlation Summary
| Measurement | Immigrants from Kazakhstan | Immigrants from Cabo Verde |
| Minimum | 6.2% | 21.0% |
| Maximum | 100.0% | 71.8% |
| Range | 93.8% | 50.8% |
| Mean | 39.1% | 44.7% |
| Median | 35.6% | 44.8% |
| Interquartile 25% (IQ1) | 29.8% | 39.5% |
| Interquartile 75% (IQ3) | 43.9% | 49.9% |
| Interquartile Range (IQR) | 14.1% | 10.4% |
| Standard Deviation (Sample) | 18.0% | 9.3% |
| Standard Deviation (Population) | 17.9% | 9.2% |
Similar Demographics by In Labor Force | Age 16-19
Demographics Similar to Immigrants from Kazakhstan by In Labor Force | Age 16-19
In terms of in labor force | age 16-19, the demographic groups most similar to Immigrants from Kazakhstan are Immigrants from Syria (35.2%, a difference of 0.0%), Immigrants from France (35.1%, a difference of 0.040%), Immigrants from Mexico (35.1%, a difference of 0.080%), Immigrants from Honduras (35.2%, a difference of 0.12%), and Immigrants from Lebanon (35.2%, a difference of 0.16%).
| Demographics | Rating | Rank | In Labor Force | Age 16-19 |
| Immigrants | Belgium | 6.1 /100 | #225 | Tragic 35.3% |
| Immigrants | Guatemala | 5.7 /100 | #226 | Tragic 35.3% |
| Mongolians | 5.7 /100 | #227 | Tragic 35.3% |
| Immigrants | Senegal | 5.5 /100 | #228 | Tragic 35.3% |
| Immigrants | Lebanon | 5.0 /100 | #229 | Tragic 35.2% |
| Immigrants | Honduras | 4.9 /100 | #230 | Tragic 35.2% |
| Immigrants | Syria | 4.5 /100 | #231 | Tragic 35.2% |
| Immigrants | Kazakhstan | 4.5 /100 | #232 | Tragic 35.2% |
| Immigrants | France | 4.3 /100 | #233 | Tragic 35.1% |
| Immigrants | Mexico | 4.2 /100 | #234 | Tragic 35.1% |
| Immigrants | Philippines | 4.0 /100 | #235 | Tragic 35.1% |
| Immigrants | Australia | 3.6 /100 | #236 | Tragic 35.1% |
| Immigrants | India | 3.5 /100 | #237 | Tragic 35.0% |
| Immigrants | Vietnam | 3.4 /100 | #238 | Tragic 35.0% |
| Inupiat | 3.2 /100 | #239 | Tragic 35.0% |
Demographics Similar to Immigrants from Cabo Verde by In Labor Force | Age 16-19
In terms of in labor force | age 16-19, the demographic groups most similar to Immigrants from Cabo Verde are Danish (44.7%, a difference of 0.040%), Cape Verdean (44.5%, a difference of 0.42%), Somali (45.1%, a difference of 0.99%), Alaskan Athabascan (45.2%, a difference of 1.2%), and German (44.2%, a difference of 1.2%).
| Demographics | Rating | Rank | In Labor Force | Age 16-19 |
| Pennsylvania Germans | 100.0 /100 | #1 | Exceptional 46.4% |
| Norwegians | 100.0 /100 | #2 | Exceptional 46.2% |
| Immigrants | Somalia | 100.0 /100 | #3 | Exceptional 45.6% |
| Luxembourgers | 100.0 /100 | #4 | Exceptional 45.3% |
| Alaskan Athabascans | 100.0 /100 | #5 | Exceptional 45.2% |
| Somalis | 100.0 /100 | #6 | Exceptional 45.1% |
| Danes | 100.0 /100 | #7 | Exceptional 44.7% |
| Immigrants | Cabo Verde | 100.0 /100 | #8 | Exceptional 44.7% |
| Cape Verdeans | 100.0 /100 | #9 | Exceptional 44.5% |
| Germans | 100.0 /100 | #10 | Exceptional 44.2% |
| Swedes | 100.0 /100 | #11 | Exceptional 44.1% |
| Finns | 100.0 /100 | #12 | Exceptional 43.9% |
| Dutch | 100.0 /100 | #13 | Exceptional 43.8% |
| Chippewa | 100.0 /100 | #14 | Exceptional 43.8% |
| Slovenes | 100.0 /100 | #15 | Exceptional 43.7% |