Immigrants from Jordan vs German Russian In Labor Force | Age 30-34
COMPARE
Immigrants from Jordan
German Russian
In Labor Force | Age 30-34
In Labor Force | Age 30-34 Comparison
Immigrants from Jordan
German Russians
85.0%
IN LABOR FORCE | AGE 30-34
91.5/ 100
METRIC RATING
125th/ 347
METRIC RANK
85.2%
IN LABOR FORCE | AGE 30-34
97.7/ 100
METRIC RATING
92nd/ 347
METRIC RANK
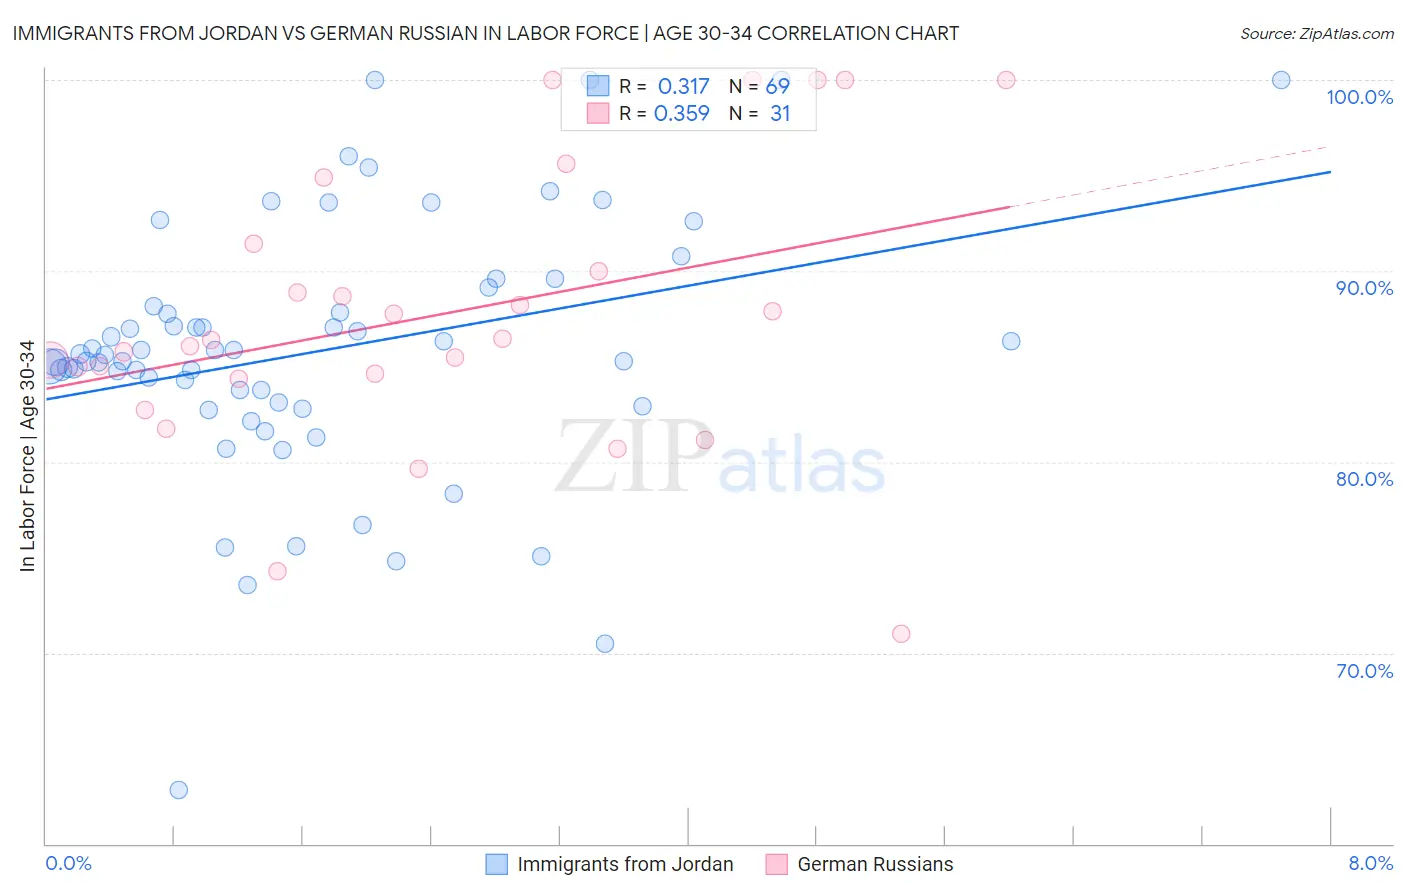
Immigrants from Jordan vs German Russian In Labor Force | Age 30-34 Correlation Chart
The statistical analysis conducted on geographies consisting of 181,256,193 people shows a mild positive correlation between the proportion of Immigrants from Jordan and labor force participation rate among population between the ages 30 and 34 in the United States with a correlation coefficient (R) of 0.317 and weighted average of 85.0%. Similarly, the statistical analysis conducted on geographies consisting of 96,447,267 people shows a mild positive correlation between the proportion of German Russians and labor force participation rate among population between the ages 30 and 34 in the United States with a correlation coefficient (R) of 0.359 and weighted average of 85.2%, a difference of 0.24%.
In Labor Force | Age 30-34 Correlation Summary
| Measurement | Immigrants from Jordan | German Russian |
| Minimum | 62.8% | 71.0% |
| Maximum | 100.0% | 100.0% |
| Range | 37.2% | 29.0% |
| Mean | 85.8% | 87.7% |
| Median | 85.6% | 86.4% |
| Interquartile 25% (IQ1) | 83.0% | 84.3% |
| Interquartile 75% (IQ3) | 88.6% | 91.4% |
| Interquartile Range (IQR) | 5.6% | 7.1% |
| Standard Deviation (Sample) | 6.8% | 7.4% |
| Standard Deviation (Population) | 6.8% | 7.2% |
Similar Demographics by In Labor Force | Age 30-34
Demographics Similar to Immigrants from Jordan by In Labor Force | Age 30-34
In terms of in labor force | age 30-34, the demographic groups most similar to Immigrants from Jordan are Australian (85.0%, a difference of 0.010%), Austrian (85.0%, a difference of 0.010%), Armenian (85.0%, a difference of 0.020%), Slavic (85.0%, a difference of 0.020%), and Immigrants from Argentina (85.0%, a difference of 0.020%).
| Demographics | Rating | Rank | In Labor Force | Age 30-34 |
| Immigrants | Malaysia | 94.2 /100 | #118 | Exceptional 85.1% |
| Asians | 93.4 /100 | #119 | Exceptional 85.1% |
| Immigrants | Southern Europe | 93.3 /100 | #120 | Exceptional 85.1% |
| Immigrants | Egypt | 93.2 /100 | #121 | Exceptional 85.1% |
| Immigrants | Kuwait | 92.6 /100 | #122 | Exceptional 85.1% |
| Armenians | 92.2 /100 | #123 | Exceptional 85.0% |
| Australians | 92.0 /100 | #124 | Exceptional 85.0% |
| Immigrants | Jordan | 91.5 /100 | #125 | Exceptional 85.0% |
| Austrians | 90.9 /100 | #126 | Exceptional 85.0% |
| Slavs | 90.7 /100 | #127 | Exceptional 85.0% |
| Immigrants | Argentina | 90.6 /100 | #128 | Exceptional 85.0% |
| Immigrants | Western Africa | 90.2 /100 | #129 | Exceptional 85.0% |
| Immigrants | Spain | 90.0 /100 | #130 | Exceptional 85.0% |
| Chinese | 89.6 /100 | #131 | Excellent 85.0% |
| Immigrants | Israel | 89.5 /100 | #132 | Excellent 85.0% |
Demographics Similar to German Russians by In Labor Force | Age 30-34
In terms of in labor force | age 30-34, the demographic groups most similar to German Russians are Immigrants from Moldova (85.3%, a difference of 0.010%), Immigrants from Norway (85.2%, a difference of 0.010%), Burmese (85.3%, a difference of 0.020%), Swedish (85.2%, a difference of 0.020%), and Immigrants from India (85.2%, a difference of 0.020%).
| Demographics | Rating | Rank | In Labor Force | Age 30-34 |
| Mongolians | 98.5 /100 | #85 | Exceptional 85.3% |
| Immigrants | Taiwan | 98.3 /100 | #86 | Exceptional 85.3% |
| Immigrants | Northern Europe | 98.2 /100 | #87 | Exceptional 85.3% |
| Immigrants | Belgium | 98.2 /100 | #88 | Exceptional 85.3% |
| Immigrants | Kazakhstan | 98.1 /100 | #89 | Exceptional 85.3% |
| Burmese | 97.9 /100 | #90 | Exceptional 85.3% |
| Immigrants | Moldova | 97.9 /100 | #91 | Exceptional 85.3% |
| German Russians | 97.7 /100 | #92 | Exceptional 85.2% |
| Immigrants | Norway | 97.6 /100 | #93 | Exceptional 85.2% |
| Swedes | 97.5 /100 | #94 | Exceptional 85.2% |
| Immigrants | India | 97.4 /100 | #95 | Exceptional 85.2% |
| Immigrants | Korea | 97.3 /100 | #96 | Exceptional 85.2% |
| Thais | 97.2 /100 | #97 | Exceptional 85.2% |
| Immigrants | Uganda | 97.2 /100 | #98 | Exceptional 85.2% |
| Belgians | 97.2 /100 | #99 | Exceptional 85.2% |