Indonesian vs German Russian In Labor Force | Age 30-34
COMPARE
Indonesian
German Russian
In Labor Force | Age 30-34
In Labor Force | Age 30-34 Comparison
Indonesians
German Russians
84.3%
IN LABOR FORCE | AGE 30-34
8.8/ 100
METRIC RATING
210th/ 347
METRIC RANK
85.2%
IN LABOR FORCE | AGE 30-34
97.7/ 100
METRIC RATING
92nd/ 347
METRIC RANK
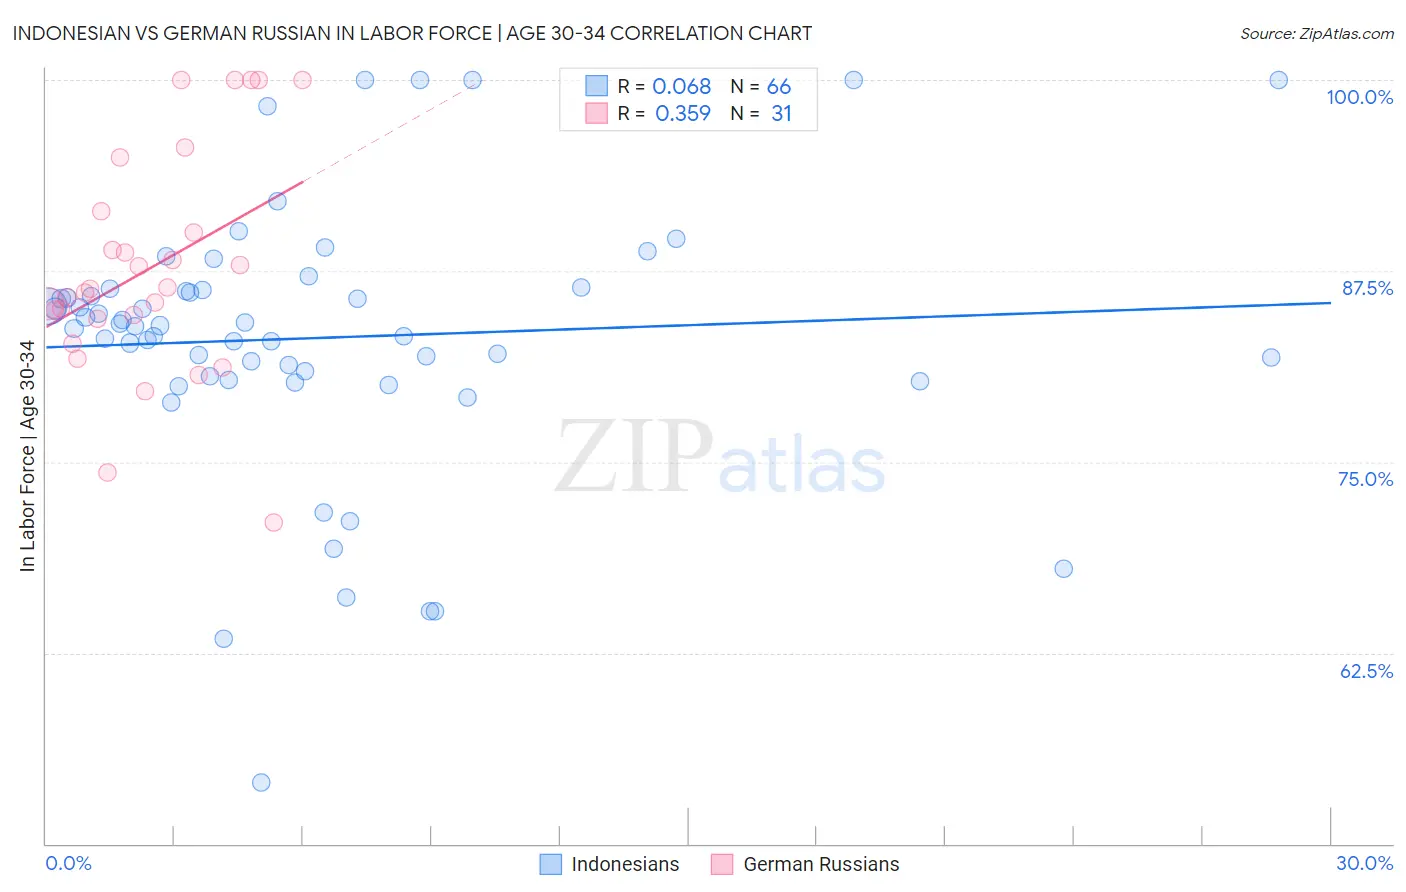
Indonesian vs German Russian In Labor Force | Age 30-34 Correlation Chart
The statistical analysis conducted on geographies consisting of 162,689,196 people shows a slight positive correlation between the proportion of Indonesians and labor force participation rate among population between the ages 30 and 34 in the United States with a correlation coefficient (R) of 0.068 and weighted average of 84.3%. Similarly, the statistical analysis conducted on geographies consisting of 96,447,267 people shows a mild positive correlation between the proportion of German Russians and labor force participation rate among population between the ages 30 and 34 in the United States with a correlation coefficient (R) of 0.359 and weighted average of 85.2%, a difference of 1.1%.
In Labor Force | Age 30-34 Correlation Summary
| Measurement | Indonesian | German Russian |
| Minimum | 54.0% | 71.0% |
| Maximum | 100.0% | 100.0% |
| Range | 46.0% | 29.0% |
| Mean | 83.1% | 87.7% |
| Median | 83.9% | 86.4% |
| Interquartile 25% (IQ1) | 80.6% | 84.3% |
| Interquartile 75% (IQ3) | 86.2% | 91.4% |
| Interquartile Range (IQR) | 5.6% | 7.1% |
| Standard Deviation (Sample) | 8.8% | 7.4% |
| Standard Deviation (Population) | 8.7% | 7.2% |
Similar Demographics by In Labor Force | Age 30-34
Demographics Similar to Indonesians by In Labor Force | Age 30-34
In terms of in labor force | age 30-34, the demographic groups most similar to Indonesians are Arab (84.3%, a difference of 0.0%), Jamaican (84.3%, a difference of 0.0%), Japanese (84.3%, a difference of 0.0%), Bangladeshi (84.3%, a difference of 0.010%), and Immigrants from Western Asia (84.3%, a difference of 0.010%).
| Demographics | Rating | Rank | In Labor Force | Age 30-34 |
| Canadians | 15.4 /100 | #203 | Poor 84.4% |
| Ecuadorians | 14.2 /100 | #204 | Poor 84.4% |
| French | 13.8 /100 | #205 | Poor 84.4% |
| Lebanese | 10.6 /100 | #206 | Poor 84.4% |
| Bangladeshis | 9.4 /100 | #207 | Tragic 84.3% |
| Arabs | 8.9 /100 | #208 | Tragic 84.3% |
| Jamaicans | 8.8 /100 | #209 | Tragic 84.3% |
| Indonesians | 8.8 /100 | #210 | Tragic 84.3% |
| Japanese | 8.8 /100 | #211 | Tragic 84.3% |
| Immigrants | Western Asia | 8.2 /100 | #212 | Tragic 84.3% |
| Immigrants | Jamaica | 7.9 /100 | #213 | Tragic 84.3% |
| Immigrants | Germany | 7.2 /100 | #214 | Tragic 84.3% |
| Europeans | 7.2 /100 | #215 | Tragic 84.3% |
| Immigrants | Ecuador | 7.1 /100 | #216 | Tragic 84.3% |
| Immigrants | Trinidad and Tobago | 7.0 /100 | #217 | Tragic 84.3% |
Demographics Similar to German Russians by In Labor Force | Age 30-34
In terms of in labor force | age 30-34, the demographic groups most similar to German Russians are Immigrants from Moldova (85.3%, a difference of 0.010%), Immigrants from Norway (85.2%, a difference of 0.010%), Burmese (85.3%, a difference of 0.020%), Swedish (85.2%, a difference of 0.020%), and Immigrants from India (85.2%, a difference of 0.020%).
| Demographics | Rating | Rank | In Labor Force | Age 30-34 |
| Mongolians | 98.5 /100 | #85 | Exceptional 85.3% |
| Immigrants | Taiwan | 98.3 /100 | #86 | Exceptional 85.3% |
| Immigrants | Northern Europe | 98.2 /100 | #87 | Exceptional 85.3% |
| Immigrants | Belgium | 98.2 /100 | #88 | Exceptional 85.3% |
| Immigrants | Kazakhstan | 98.1 /100 | #89 | Exceptional 85.3% |
| Burmese | 97.9 /100 | #90 | Exceptional 85.3% |
| Immigrants | Moldova | 97.9 /100 | #91 | Exceptional 85.3% |
| German Russians | 97.7 /100 | #92 | Exceptional 85.2% |
| Immigrants | Norway | 97.6 /100 | #93 | Exceptional 85.2% |
| Swedes | 97.5 /100 | #94 | Exceptional 85.2% |
| Immigrants | India | 97.4 /100 | #95 | Exceptional 85.2% |
| Immigrants | Korea | 97.3 /100 | #96 | Exceptional 85.2% |
| Thais | 97.2 /100 | #97 | Exceptional 85.2% |
| Immigrants | Uganda | 97.2 /100 | #98 | Exceptional 85.2% |
| Belgians | 97.2 /100 | #99 | Exceptional 85.2% |