Immigrants from Jordan vs Mexican American Indian In Labor Force | Age 30-34
COMPARE
Immigrants from Jordan
Mexican American Indian
In Labor Force | Age 30-34
In Labor Force | Age 30-34 Comparison
Immigrants from Jordan
Mexican American Indians
85.0%
IN LABOR FORCE | AGE 30-34
91.5/ 100
METRIC RATING
125th/ 347
METRIC RANK
83.2%
IN LABOR FORCE | AGE 30-34
0.0/ 100
METRIC RATING
282nd/ 347
METRIC RANK
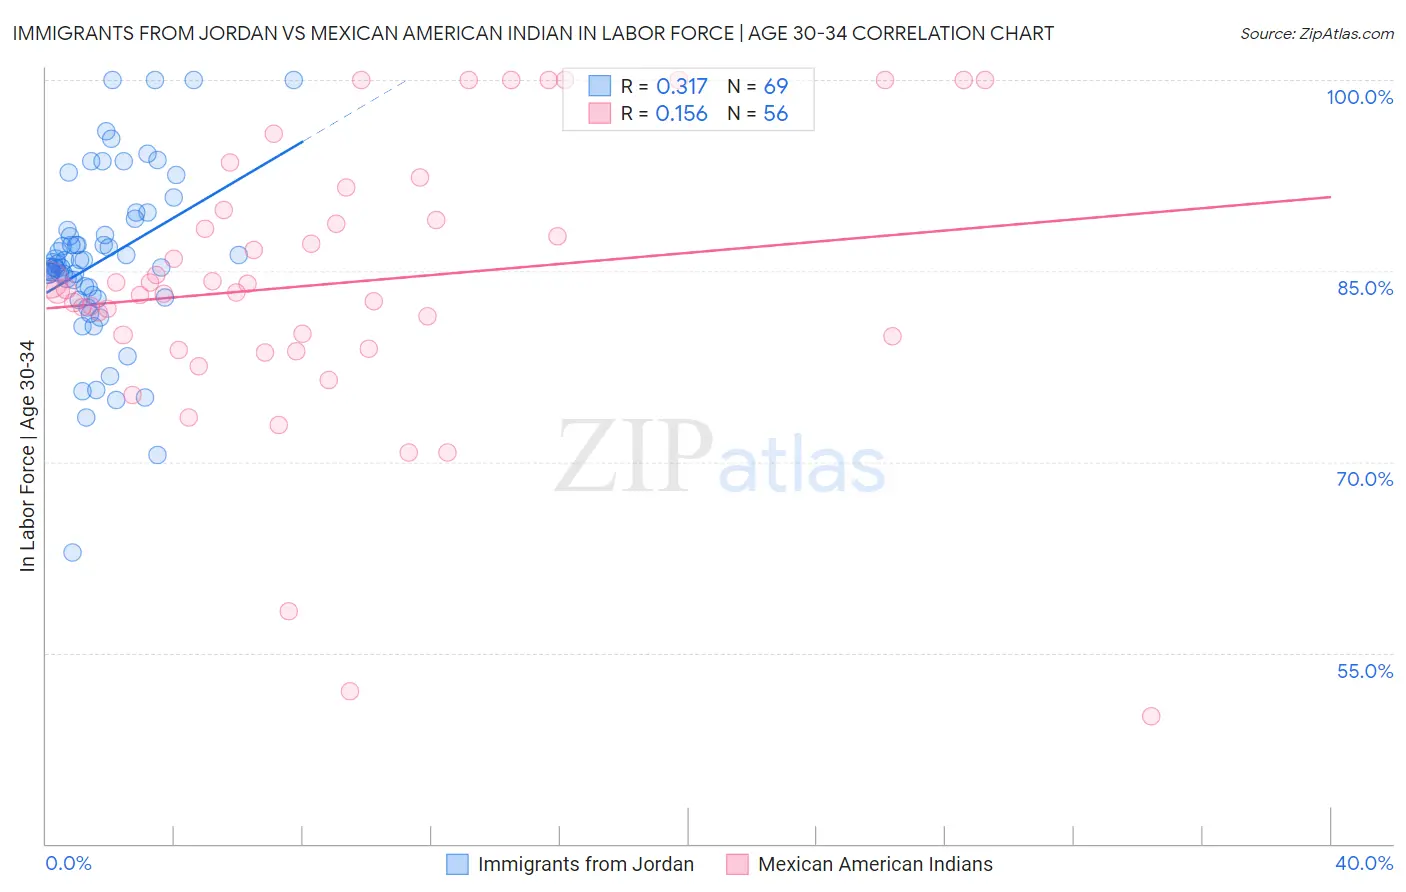
Immigrants from Jordan vs Mexican American Indian In Labor Force | Age 30-34 Correlation Chart
The statistical analysis conducted on geographies consisting of 181,256,193 people shows a mild positive correlation between the proportion of Immigrants from Jordan and labor force participation rate among population between the ages 30 and 34 in the United States with a correlation coefficient (R) of 0.317 and weighted average of 85.0%. Similarly, the statistical analysis conducted on geographies consisting of 317,534,502 people shows a poor positive correlation between the proportion of Mexican American Indians and labor force participation rate among population between the ages 30 and 34 in the United States with a correlation coefficient (R) of 0.156 and weighted average of 83.2%, a difference of 2.2%.
In Labor Force | Age 30-34 Correlation Summary
| Measurement | Immigrants from Jordan | Mexican American Indian |
| Minimum | 62.8% | 50.0% |
| Maximum | 100.0% | 100.0% |
| Range | 37.2% | 50.0% |
| Mean | 85.8% | 84.0% |
| Median | 85.6% | 83.5% |
| Interquartile 25% (IQ1) | 83.0% | 79.4% |
| Interquartile 75% (IQ3) | 88.6% | 89.4% |
| Interquartile Range (IQR) | 5.6% | 10.0% |
| Standard Deviation (Sample) | 6.8% | 10.9% |
| Standard Deviation (Population) | 6.8% | 10.8% |
Similar Demographics by In Labor Force | Age 30-34
Demographics Similar to Immigrants from Jordan by In Labor Force | Age 30-34
In terms of in labor force | age 30-34, the demographic groups most similar to Immigrants from Jordan are Australian (85.0%, a difference of 0.010%), Austrian (85.0%, a difference of 0.010%), Armenian (85.0%, a difference of 0.020%), Slavic (85.0%, a difference of 0.020%), and Immigrants from Argentina (85.0%, a difference of 0.020%).
| Demographics | Rating | Rank | In Labor Force | Age 30-34 |
| Immigrants | Malaysia | 94.2 /100 | #118 | Exceptional 85.1% |
| Asians | 93.4 /100 | #119 | Exceptional 85.1% |
| Immigrants | Southern Europe | 93.3 /100 | #120 | Exceptional 85.1% |
| Immigrants | Egypt | 93.2 /100 | #121 | Exceptional 85.1% |
| Immigrants | Kuwait | 92.6 /100 | #122 | Exceptional 85.1% |
| Armenians | 92.2 /100 | #123 | Exceptional 85.0% |
| Australians | 92.0 /100 | #124 | Exceptional 85.0% |
| Immigrants | Jordan | 91.5 /100 | #125 | Exceptional 85.0% |
| Austrians | 90.9 /100 | #126 | Exceptional 85.0% |
| Slavs | 90.7 /100 | #127 | Exceptional 85.0% |
| Immigrants | Argentina | 90.6 /100 | #128 | Exceptional 85.0% |
| Immigrants | Western Africa | 90.2 /100 | #129 | Exceptional 85.0% |
| Immigrants | Spain | 90.0 /100 | #130 | Exceptional 85.0% |
| Chinese | 89.6 /100 | #131 | Excellent 85.0% |
| Immigrants | Israel | 89.5 /100 | #132 | Excellent 85.0% |
Demographics Similar to Mexican American Indians by In Labor Force | Age 30-34
In terms of in labor force | age 30-34, the demographic groups most similar to Mexican American Indians are Assyrian/Chaldean/Syriac (83.2%, a difference of 0.010%), Samoan (83.3%, a difference of 0.040%), Immigrants from Belize (83.2%, a difference of 0.070%), Cree (83.2%, a difference of 0.070%), and Immigrants from Latin America (83.1%, a difference of 0.12%).
| Demographics | Rating | Rank | In Labor Force | Age 30-34 |
| Immigrants | Grenada | 0.0 /100 | #275 | Tragic 83.5% |
| Tongans | 0.0 /100 | #276 | Tragic 83.5% |
| Delaware | 0.0 /100 | #277 | Tragic 83.5% |
| Fijians | 0.0 /100 | #278 | Tragic 83.4% |
| Immigrants | Fiji | 0.0 /100 | #279 | Tragic 83.4% |
| Africans | 0.0 /100 | #280 | Tragic 83.4% |
| Samoans | 0.0 /100 | #281 | Tragic 83.3% |
| Mexican American Indians | 0.0 /100 | #282 | Tragic 83.2% |
| Assyrians/Chaldeans/Syriacs | 0.0 /100 | #283 | Tragic 83.2% |
| Immigrants | Belize | 0.0 /100 | #284 | Tragic 83.2% |
| Cree | 0.0 /100 | #285 | Tragic 83.2% |
| Immigrants | Latin America | 0.0 /100 | #286 | Tragic 83.1% |
| Native Hawaiians | 0.0 /100 | #287 | Tragic 83.0% |
| Central American Indians | 0.0 /100 | #288 | Tragic 83.0% |
| Hawaiians | 0.0 /100 | #289 | Tragic 83.0% |