Immigrants from Jordan vs Immigrants from Bahamas In Labor Force | Age 30-34
COMPARE
Immigrants from Jordan
Immigrants from Bahamas
In Labor Force | Age 30-34
In Labor Force | Age 30-34 Comparison
Immigrants from Jordan
Immigrants from Bahamas
85.0%
IN LABOR FORCE | AGE 30-34
91.5/ 100
METRIC RATING
125th/ 347
METRIC RANK
84.1%
IN LABOR FORCE | AGE 30-34
2.6/ 100
METRIC RATING
230th/ 347
METRIC RANK
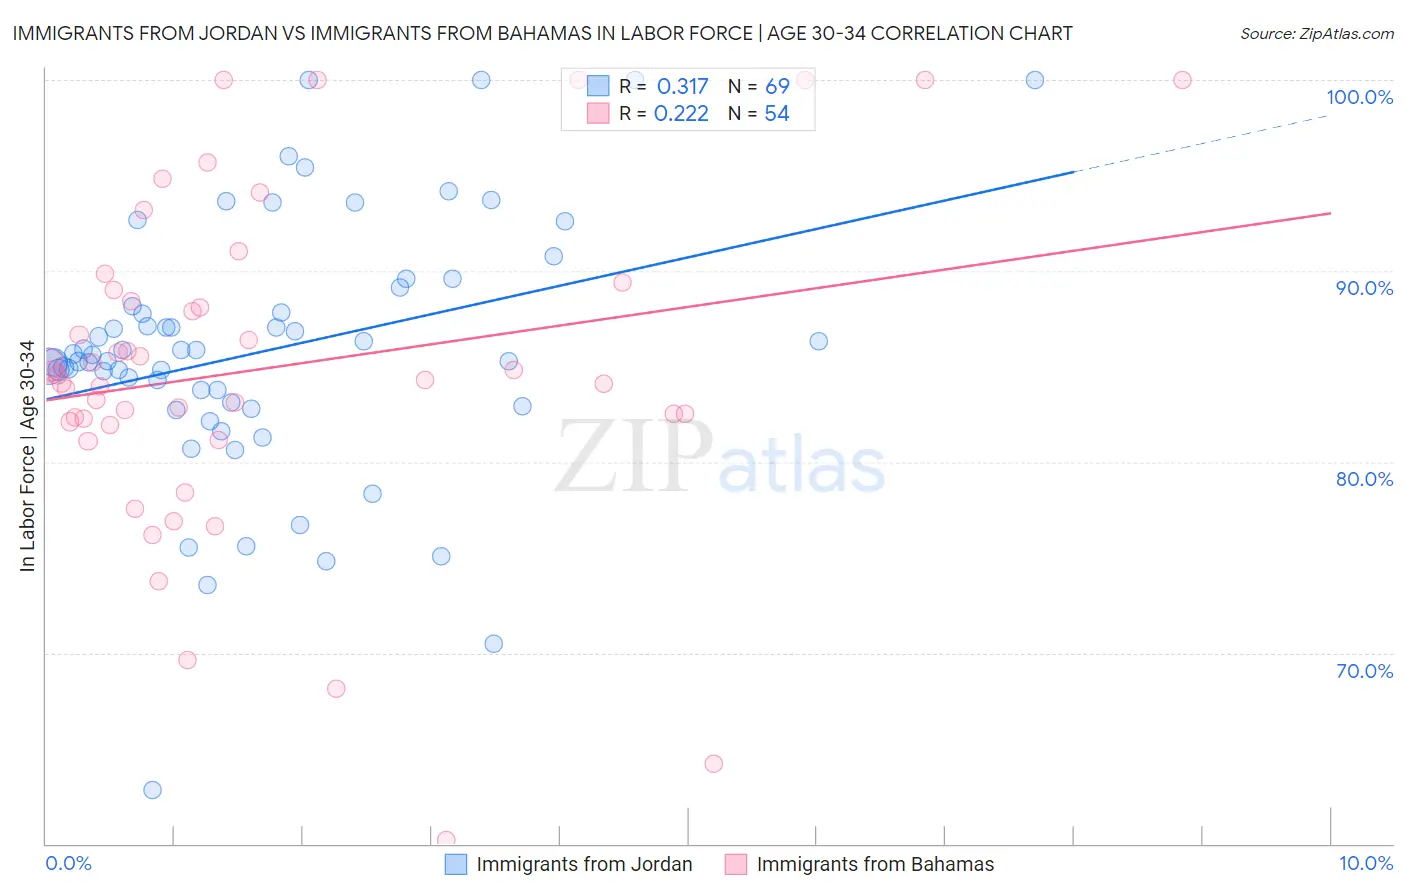
Immigrants from Jordan vs Immigrants from Bahamas In Labor Force | Age 30-34 Correlation Chart
The statistical analysis conducted on geographies consisting of 181,256,193 people shows a mild positive correlation between the proportion of Immigrants from Jordan and labor force participation rate among population between the ages 30 and 34 in the United States with a correlation coefficient (R) of 0.317 and weighted average of 85.0%. Similarly, the statistical analysis conducted on geographies consisting of 104,609,089 people shows a weak positive correlation between the proportion of Immigrants from Bahamas and labor force participation rate among population between the ages 30 and 34 in the United States with a correlation coefficient (R) of 0.222 and weighted average of 84.1%, a difference of 1.1%.
In Labor Force | Age 30-34 Correlation Summary
| Measurement | Immigrants from Jordan | Immigrants from Bahamas |
| Minimum | 62.8% | 60.2% |
| Maximum | 100.0% | 100.0% |
| Range | 37.2% | 39.8% |
| Mean | 85.8% | 84.9% |
| Median | 85.6% | 84.4% |
| Interquartile 25% (IQ1) | 83.0% | 82.1% |
| Interquartile 75% (IQ3) | 88.6% | 89.0% |
| Interquartile Range (IQR) | 5.6% | 6.9% |
| Standard Deviation (Sample) | 6.8% | 8.6% |
| Standard Deviation (Population) | 6.8% | 8.6% |
Similar Demographics by In Labor Force | Age 30-34
Demographics Similar to Immigrants from Jordan by In Labor Force | Age 30-34
In terms of in labor force | age 30-34, the demographic groups most similar to Immigrants from Jordan are Australian (85.0%, a difference of 0.010%), Austrian (85.0%, a difference of 0.010%), Armenian (85.0%, a difference of 0.020%), Slavic (85.0%, a difference of 0.020%), and Immigrants from Argentina (85.0%, a difference of 0.020%).
| Demographics | Rating | Rank | In Labor Force | Age 30-34 |
| Immigrants | Malaysia | 94.2 /100 | #118 | Exceptional 85.1% |
| Asians | 93.4 /100 | #119 | Exceptional 85.1% |
| Immigrants | Southern Europe | 93.3 /100 | #120 | Exceptional 85.1% |
| Immigrants | Egypt | 93.2 /100 | #121 | Exceptional 85.1% |
| Immigrants | Kuwait | 92.6 /100 | #122 | Exceptional 85.1% |
| Armenians | 92.2 /100 | #123 | Exceptional 85.0% |
| Australians | 92.0 /100 | #124 | Exceptional 85.0% |
| Immigrants | Jordan | 91.5 /100 | #125 | Exceptional 85.0% |
| Austrians | 90.9 /100 | #126 | Exceptional 85.0% |
| Slavs | 90.7 /100 | #127 | Exceptional 85.0% |
| Immigrants | Argentina | 90.6 /100 | #128 | Exceptional 85.0% |
| Immigrants | Western Africa | 90.2 /100 | #129 | Exceptional 85.0% |
| Immigrants | Spain | 90.0 /100 | #130 | Exceptional 85.0% |
| Chinese | 89.6 /100 | #131 | Excellent 85.0% |
| Immigrants | Israel | 89.5 /100 | #132 | Excellent 85.0% |
Demographics Similar to Immigrants from Bahamas by In Labor Force | Age 30-34
In terms of in labor force | age 30-34, the demographic groups most similar to Immigrants from Bahamas are Welsh (84.2%, a difference of 0.010%), Immigrants from Cuba (84.2%, a difference of 0.020%), Immigrants from Haiti (84.2%, a difference of 0.020%), Scottish (84.2%, a difference of 0.030%), and Immigrants from El Salvador (84.2%, a difference of 0.030%).
| Demographics | Rating | Rank | In Labor Force | Age 30-34 |
| Immigrants | Laos | 3.6 /100 | #223 | Tragic 84.2% |
| Cubans | 3.4 /100 | #224 | Tragic 84.2% |
| Scottish | 3.1 /100 | #225 | Tragic 84.2% |
| Immigrants | El Salvador | 3.0 /100 | #226 | Tragic 84.2% |
| Immigrants | Cuba | 3.0 /100 | #227 | Tragic 84.2% |
| Immigrants | Haiti | 2.8 /100 | #228 | Tragic 84.2% |
| Welsh | 2.7 /100 | #229 | Tragic 84.2% |
| Immigrants | Bahamas | 2.6 /100 | #230 | Tragic 84.1% |
| Malaysians | 2.2 /100 | #231 | Tragic 84.1% |
| Immigrants | Immigrants | 2.0 /100 | #232 | Tragic 84.1% |
| West Indians | 1.9 /100 | #233 | Tragic 84.1% |
| Haitians | 1.8 /100 | #234 | Tragic 84.1% |
| French American Indians | 1.7 /100 | #235 | Tragic 84.1% |
| U.S. Virgin Islanders | 1.5 /100 | #236 | Tragic 84.1% |
| Celtics | 1.4 /100 | #237 | Tragic 84.1% |