Czech vs German Russian In Labor Force | Age 30-34
COMPARE
Czech
German Russian
In Labor Force | Age 30-34
In Labor Force | Age 30-34 Comparison
Czechs
German Russians
85.5%
IN LABOR FORCE | AGE 30-34
99.6/ 100
METRIC RATING
56th/ 347
METRIC RANK
85.2%
IN LABOR FORCE | AGE 30-34
97.7/ 100
METRIC RATING
92nd/ 347
METRIC RANK
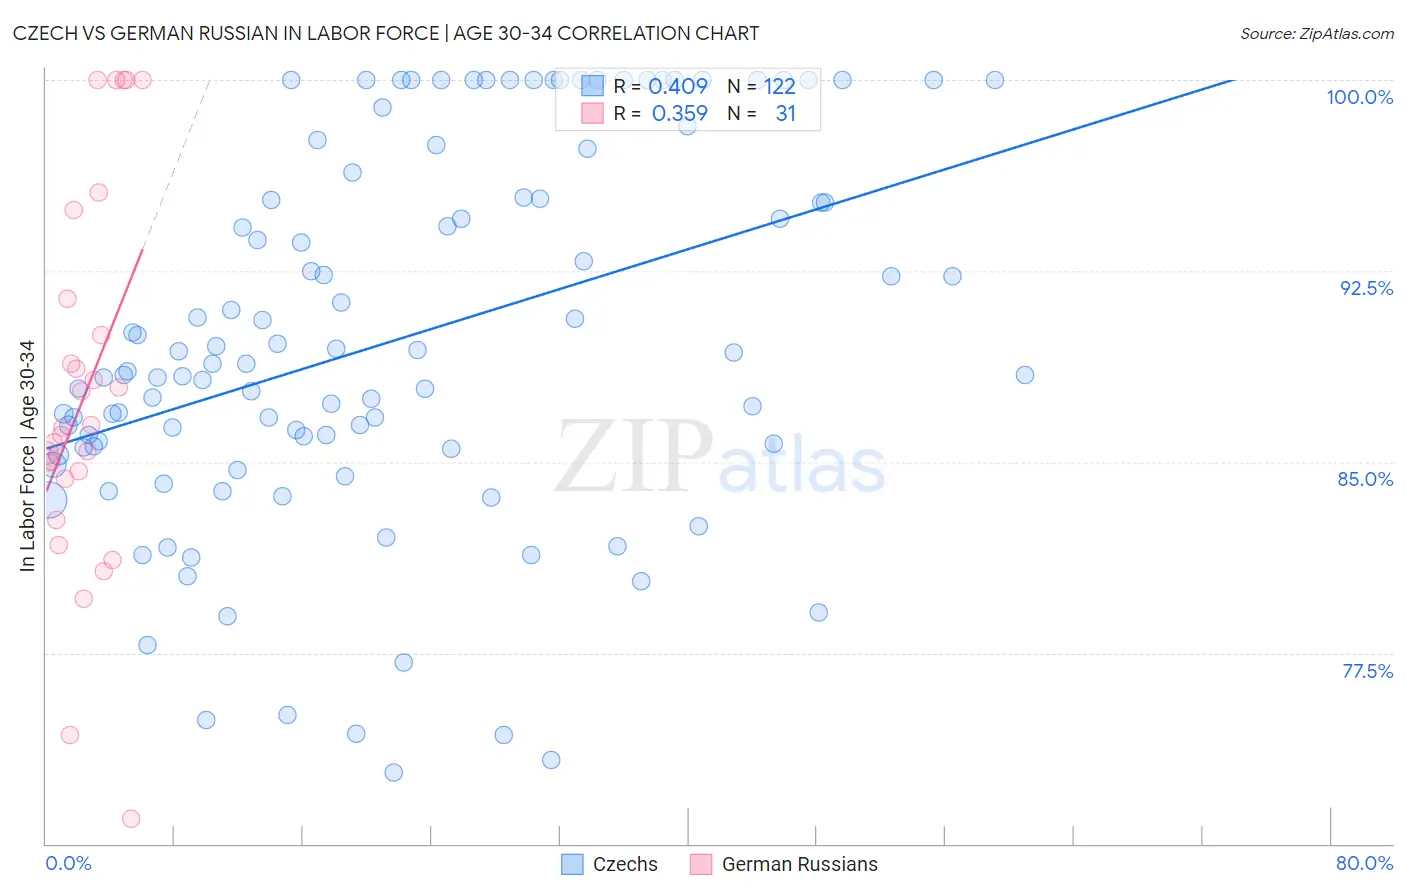
Czech vs German Russian In Labor Force | Age 30-34 Correlation Chart
The statistical analysis conducted on geographies consisting of 484,299,393 people shows a moderate positive correlation between the proportion of Czechs and labor force participation rate among population between the ages 30 and 34 in the United States with a correlation coefficient (R) of 0.409 and weighted average of 85.5%. Similarly, the statistical analysis conducted on geographies consisting of 96,447,267 people shows a mild positive correlation between the proportion of German Russians and labor force participation rate among population between the ages 30 and 34 in the United States with a correlation coefficient (R) of 0.359 and weighted average of 85.2%, a difference of 0.30%.
In Labor Force | Age 30-34 Correlation Summary
| Measurement | Czech | German Russian |
| Minimum | 72.8% | 71.0% |
| Maximum | 100.0% | 100.0% |
| Range | 27.2% | 29.0% |
| Mean | 89.8% | 87.7% |
| Median | 88.7% | 86.4% |
| Interquartile 25% (IQ1) | 85.6% | 84.3% |
| Interquartile 75% (IQ3) | 95.4% | 91.4% |
| Interquartile Range (IQR) | 9.8% | 7.1% |
| Standard Deviation (Sample) | 7.3% | 7.4% |
| Standard Deviation (Population) | 7.3% | 7.2% |
Similar Demographics by In Labor Force | Age 30-34
Demographics Similar to Czechs by In Labor Force | Age 30-34
In terms of in labor force | age 30-34, the demographic groups most similar to Czechs are Russian (85.5%, a difference of 0.0%), Immigrants from Kenya (85.5%, a difference of 0.010%), Immigrants from Turkey (85.5%, a difference of 0.010%), Polish (85.5%, a difference of 0.010%), and Filipino (85.5%, a difference of 0.020%).
| Demographics | Rating | Rank | In Labor Force | Age 30-34 |
| Lithuanians | 99.8 /100 | #49 | Exceptional 85.6% |
| Immigrants | Australia | 99.8 /100 | #50 | Exceptional 85.6% |
| Cape Verdeans | 99.7 /100 | #51 | Exceptional 85.6% |
| Slovenes | 99.7 /100 | #52 | Exceptional 85.6% |
| Filipinos | 99.6 /100 | #53 | Exceptional 85.5% |
| Immigrants | Kenya | 99.6 /100 | #54 | Exceptional 85.5% |
| Immigrants | Turkey | 99.6 /100 | #55 | Exceptional 85.5% |
| Czechs | 99.6 /100 | #56 | Exceptional 85.5% |
| Russians | 99.6 /100 | #57 | Exceptional 85.5% |
| Poles | 99.6 /100 | #58 | Exceptional 85.5% |
| Immigrants | Poland | 99.5 /100 | #59 | Exceptional 85.5% |
| Immigrants | France | 99.5 /100 | #60 | Exceptional 85.5% |
| Immigrants | Brazil | 99.5 /100 | #61 | Exceptional 85.5% |
| Soviet Union | 99.4 /100 | #62 | Exceptional 85.5% |
| Macedonians | 99.4 /100 | #63 | Exceptional 85.5% |
Demographics Similar to German Russians by In Labor Force | Age 30-34
In terms of in labor force | age 30-34, the demographic groups most similar to German Russians are Immigrants from Moldova (85.3%, a difference of 0.010%), Immigrants from Norway (85.2%, a difference of 0.010%), Burmese (85.3%, a difference of 0.020%), Swedish (85.2%, a difference of 0.020%), and Immigrants from India (85.2%, a difference of 0.020%).
| Demographics | Rating | Rank | In Labor Force | Age 30-34 |
| Mongolians | 98.5 /100 | #85 | Exceptional 85.3% |
| Immigrants | Taiwan | 98.3 /100 | #86 | Exceptional 85.3% |
| Immigrants | Northern Europe | 98.2 /100 | #87 | Exceptional 85.3% |
| Immigrants | Belgium | 98.2 /100 | #88 | Exceptional 85.3% |
| Immigrants | Kazakhstan | 98.1 /100 | #89 | Exceptional 85.3% |
| Burmese | 97.9 /100 | #90 | Exceptional 85.3% |
| Immigrants | Moldova | 97.9 /100 | #91 | Exceptional 85.3% |
| German Russians | 97.7 /100 | #92 | Exceptional 85.2% |
| Immigrants | Norway | 97.6 /100 | #93 | Exceptional 85.2% |
| Swedes | 97.5 /100 | #94 | Exceptional 85.2% |
| Immigrants | India | 97.4 /100 | #95 | Exceptional 85.2% |
| Immigrants | Korea | 97.3 /100 | #96 | Exceptional 85.2% |
| Thais | 97.2 /100 | #97 | Exceptional 85.2% |
| Immigrants | Uganda | 97.2 /100 | #98 | Exceptional 85.2% |
| Belgians | 97.2 /100 | #99 | Exceptional 85.2% |