Cypriot vs German Russian In Labor Force | Age 30-34
COMPARE
Cypriot
German Russian
In Labor Force | Age 30-34
In Labor Force | Age 30-34 Comparison
Cypriots
German Russians
85.8%
IN LABOR FORCE | AGE 30-34
99.9/ 100
METRIC RATING
32nd/ 347
METRIC RANK
85.2%
IN LABOR FORCE | AGE 30-34
97.7/ 100
METRIC RATING
92nd/ 347
METRIC RANK
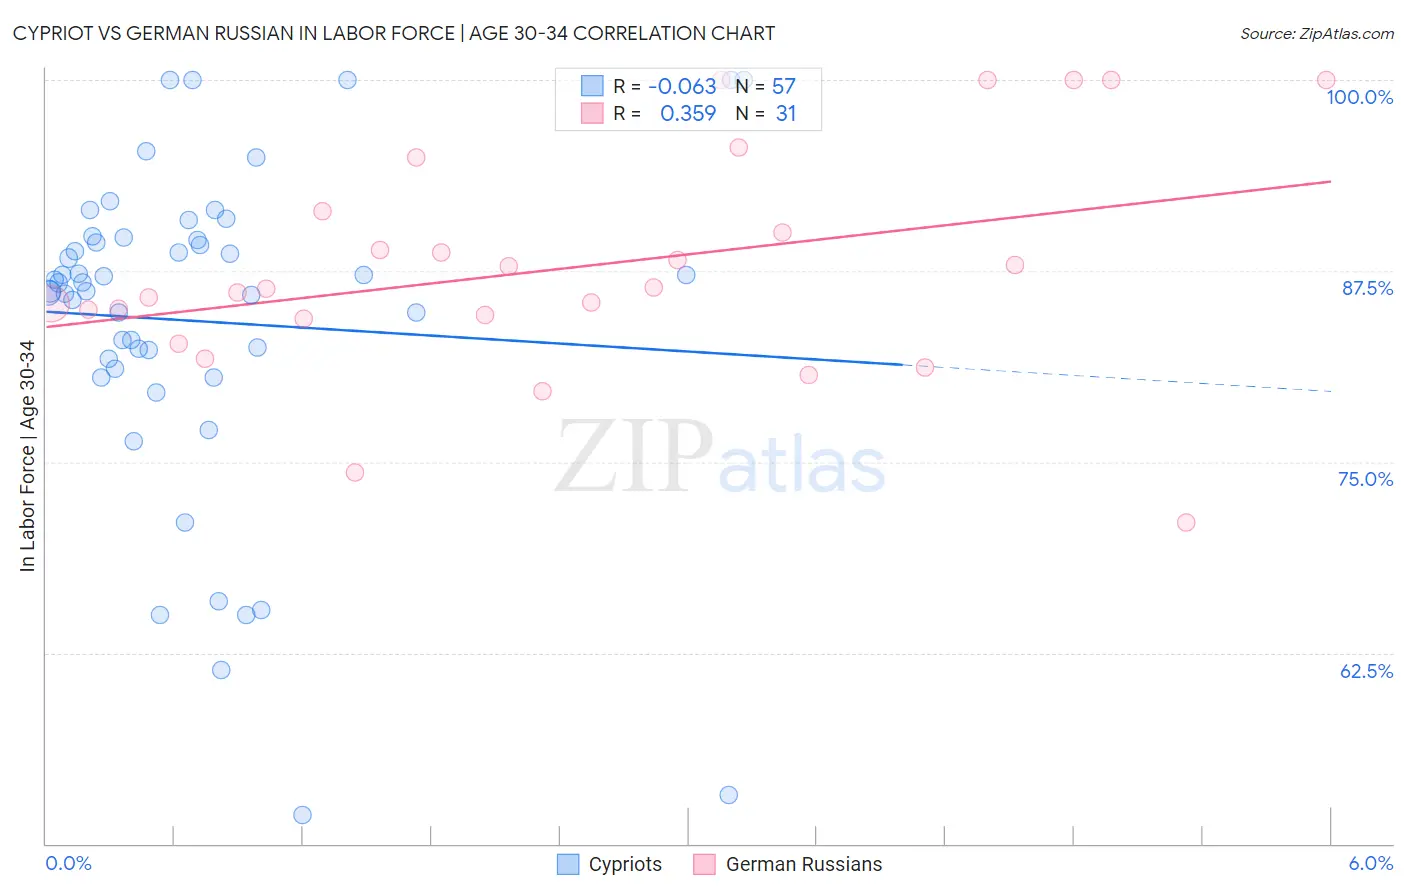
Cypriot vs German Russian In Labor Force | Age 30-34 Correlation Chart
The statistical analysis conducted on geographies consisting of 61,842,165 people shows a slight negative correlation between the proportion of Cypriots and labor force participation rate among population between the ages 30 and 34 in the United States with a correlation coefficient (R) of -0.063 and weighted average of 85.8%. Similarly, the statistical analysis conducted on geographies consisting of 96,447,267 people shows a mild positive correlation between the proportion of German Russians and labor force participation rate among population between the ages 30 and 34 in the United States with a correlation coefficient (R) of 0.359 and weighted average of 85.2%, a difference of 0.65%.
In Labor Force | Age 30-34 Correlation Summary
| Measurement | Cypriot | German Russian |
| Minimum | 51.9% | 71.0% |
| Maximum | 100.0% | 100.0% |
| Range | 48.1% | 29.0% |
| Mean | 84.2% | 87.7% |
| Median | 86.7% | 86.4% |
| Interquartile 25% (IQ1) | 81.4% | 84.3% |
| Interquartile 75% (IQ3) | 89.6% | 91.4% |
| Interquartile Range (IQR) | 8.1% | 7.1% |
| Standard Deviation (Sample) | 10.7% | 7.4% |
| Standard Deviation (Population) | 10.6% | 7.2% |
Similar Demographics by In Labor Force | Age 30-34
Demographics Similar to Cypriots by In Labor Force | Age 30-34
In terms of in labor force | age 30-34, the demographic groups most similar to Cypriots are Paraguayan (85.8%, a difference of 0.0%), Immigrants from Hong Kong (85.8%, a difference of 0.020%), Immigrants from Bosnia and Herzegovina (85.8%, a difference of 0.040%), Ugandan (85.8%, a difference of 0.050%), and Serbian (85.8%, a difference of 0.050%).
| Demographics | Rating | Rank | In Labor Force | Age 30-34 |
| Immigrants | North Macedonia | 100.0 /100 | #25 | Exceptional 85.9% |
| Immigrants | Eastern Africa | 100.0 /100 | #26 | Exceptional 85.9% |
| Immigrants | Liberia | 100.0 /100 | #27 | Exceptional 85.9% |
| Immigrants | Latvia | 100.0 /100 | #28 | Exceptional 85.9% |
| Tsimshian | 100.0 /100 | #29 | Exceptional 85.8% |
| Immigrants | Hong Kong | 100.0 /100 | #30 | Exceptional 85.8% |
| Paraguayans | 99.9 /100 | #31 | Exceptional 85.8% |
| Cypriots | 99.9 /100 | #32 | Exceptional 85.8% |
| Immigrants | Bosnia and Herzegovina | 99.9 /100 | #33 | Exceptional 85.8% |
| Ugandans | 99.9 /100 | #34 | Exceptional 85.8% |
| Serbians | 99.9 /100 | #35 | Exceptional 85.8% |
| Albanians | 99.9 /100 | #36 | Exceptional 85.7% |
| Norwegians | 99.9 /100 | #37 | Exceptional 85.7% |
| Immigrants | Greece | 99.9 /100 | #38 | Exceptional 85.7% |
| Eastern Europeans | 99.9 /100 | #39 | Exceptional 85.7% |
Demographics Similar to German Russians by In Labor Force | Age 30-34
In terms of in labor force | age 30-34, the demographic groups most similar to German Russians are Immigrants from Moldova (85.3%, a difference of 0.010%), Immigrants from Norway (85.2%, a difference of 0.010%), Burmese (85.3%, a difference of 0.020%), Swedish (85.2%, a difference of 0.020%), and Immigrants from India (85.2%, a difference of 0.020%).
| Demographics | Rating | Rank | In Labor Force | Age 30-34 |
| Mongolians | 98.5 /100 | #85 | Exceptional 85.3% |
| Immigrants | Taiwan | 98.3 /100 | #86 | Exceptional 85.3% |
| Immigrants | Northern Europe | 98.2 /100 | #87 | Exceptional 85.3% |
| Immigrants | Belgium | 98.2 /100 | #88 | Exceptional 85.3% |
| Immigrants | Kazakhstan | 98.1 /100 | #89 | Exceptional 85.3% |
| Burmese | 97.9 /100 | #90 | Exceptional 85.3% |
| Immigrants | Moldova | 97.9 /100 | #91 | Exceptional 85.3% |
| German Russians | 97.7 /100 | #92 | Exceptional 85.2% |
| Immigrants | Norway | 97.6 /100 | #93 | Exceptional 85.2% |
| Swedes | 97.5 /100 | #94 | Exceptional 85.2% |
| Immigrants | India | 97.4 /100 | #95 | Exceptional 85.2% |
| Immigrants | Korea | 97.3 /100 | #96 | Exceptional 85.2% |
| Thais | 97.2 /100 | #97 | Exceptional 85.2% |
| Immigrants | Uganda | 97.2 /100 | #98 | Exceptional 85.2% |
| Belgians | 97.2 /100 | #99 | Exceptional 85.2% |