Immigrants from Peru vs Comanche In Labor Force | Age > 16
COMPARE
Immigrants from Peru
Comanche
In Labor Force | Age > 16
In Labor Force | Age > 16 Comparison
Immigrants from Peru
Comanche
66.3%
IN LABOR FORCE | AGE > 16
99.8/ 100
METRIC RATING
60th/ 347
METRIC RANK
63.6%
IN LABOR FORCE | AGE > 16
0.0/ 100
METRIC RATING
298th/ 347
METRIC RANK
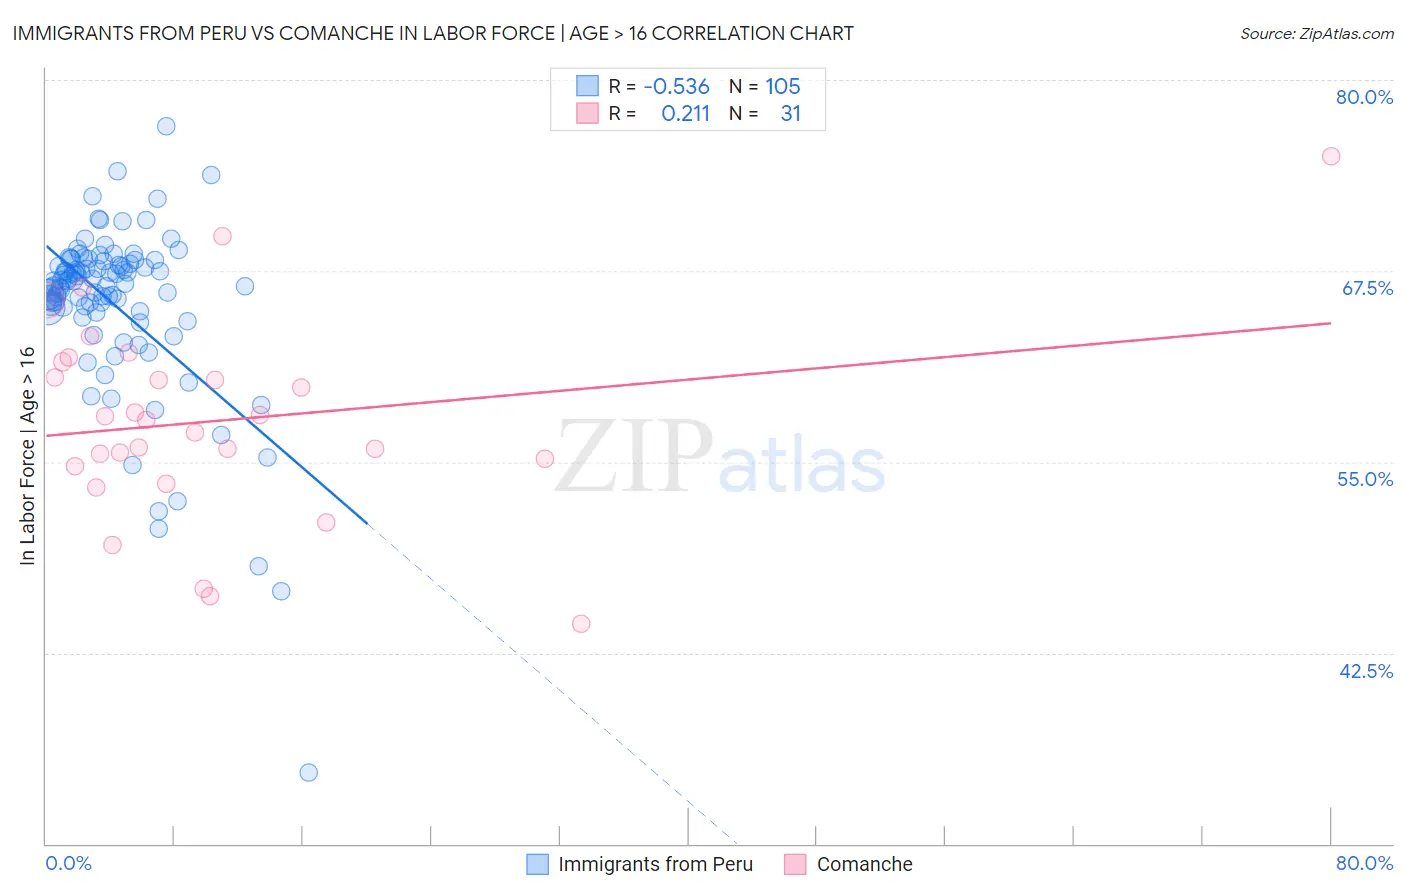
Immigrants from Peru vs Comanche In Labor Force | Age > 16 Correlation Chart
The statistical analysis conducted on geographies consisting of 328,856,106 people shows a substantial negative correlation between the proportion of Immigrants from Peru and labor force participation rate among population ages 16 and over in the United States with a correlation coefficient (R) of -0.536 and weighted average of 66.3%. Similarly, the statistical analysis conducted on geographies consisting of 109,783,732 people shows a weak positive correlation between the proportion of Comanche and labor force participation rate among population ages 16 and over in the United States with a correlation coefficient (R) of 0.211 and weighted average of 63.6%, a difference of 4.2%.
In Labor Force | Age > 16 Correlation Summary
| Measurement | Immigrants from Peru | Comanche |
| Minimum | 34.7% | 44.4% |
| Maximum | 77.0% | 75.0% |
| Range | 42.3% | 30.6% |
| Mean | 65.3% | 57.7% |
| Median | 66.7% | 57.7% |
| Interquartile 25% (IQ1) | 64.8% | 54.7% |
| Interquartile 75% (IQ3) | 68.1% | 61.5% |
| Interquartile Range (IQR) | 3.2% | 6.9% |
| Standard Deviation (Sample) | 5.8% | 6.6% |
| Standard Deviation (Population) | 5.8% | 6.5% |
Similar Demographics by In Labor Force | Age > 16
Demographics Similar to Immigrants from Peru by In Labor Force | Age > 16
In terms of in labor force | age > 16, the demographic groups most similar to Immigrants from Peru are Immigrants from Burma/Myanmar (66.3%, a difference of 0.0%), Indonesian (66.3%, a difference of 0.0%), Immigrants from Turkey (66.3%, a difference of 0.020%), Venezuelan (66.3%, a difference of 0.040%), and Peruvian (66.3%, a difference of 0.040%).
| Demographics | Rating | Rank | In Labor Force | Age > 16 |
| Immigrants | Sri Lanka | 99.9 /100 | #53 | Exceptional 66.5% |
| Immigrants | Bosnia and Herzegovina | 99.9 /100 | #54 | Exceptional 66.5% |
| Immigrants | Venezuela | 99.9 /100 | #55 | Exceptional 66.4% |
| Immigrants | Senegal | 99.9 /100 | #56 | Exceptional 66.4% |
| Bulgarians | 99.9 /100 | #57 | Exceptional 66.4% |
| Immigrants | Saudi Arabia | 99.9 /100 | #58 | Exceptional 66.3% |
| Immigrants | Turkey | 99.9 /100 | #59 | Exceptional 66.3% |
| Immigrants | Peru | 99.8 /100 | #60 | Exceptional 66.3% |
| Immigrants | Burma/Myanmar | 99.8 /100 | #61 | Exceptional 66.3% |
| Indonesians | 99.8 /100 | #62 | Exceptional 66.3% |
| Venezuelans | 99.8 /100 | #63 | Exceptional 66.3% |
| Peruvians | 99.8 /100 | #64 | Exceptional 66.3% |
| Sri Lankans | 99.8 /100 | #65 | Exceptional 66.3% |
| Jordanians | 99.8 /100 | #66 | Exceptional 66.3% |
| Egyptians | 99.8 /100 | #67 | Exceptional 66.2% |
Demographics Similar to Comanche by In Labor Force | Age > 16
In terms of in labor force | age > 16, the demographic groups most similar to Comanche are Immigrants from Grenada (63.6%, a difference of 0.010%), White/Caucasian (63.6%, a difference of 0.060%), Immigrants from the Azores (63.6%, a difference of 0.060%), Immigrants from North America (63.7%, a difference of 0.090%), and Spanish American (63.6%, a difference of 0.090%).
| Demographics | Rating | Rank | In Labor Force | Age > 16 |
| Nepalese | 0.1 /100 | #291 | Tragic 63.8% |
| Spanish American Indians | 0.1 /100 | #292 | Tragic 63.8% |
| English | 0.1 /100 | #293 | Tragic 63.7% |
| Puget Sound Salish | 0.0 /100 | #294 | Tragic 63.7% |
| Immigrants | Canada | 0.0 /100 | #295 | Tragic 63.7% |
| Immigrants | North America | 0.0 /100 | #296 | Tragic 63.7% |
| Immigrants | Grenada | 0.0 /100 | #297 | Tragic 63.6% |
| Comanche | 0.0 /100 | #298 | Tragic 63.6% |
| Whites/Caucasians | 0.0 /100 | #299 | Tragic 63.6% |
| Immigrants | Azores | 0.0 /100 | #300 | Tragic 63.6% |
| Spanish Americans | 0.0 /100 | #301 | Tragic 63.6% |
| Delaware | 0.0 /100 | #302 | Tragic 63.6% |
| Cree | 0.0 /100 | #303 | Tragic 63.5% |
| Immigrants | Nonimmigrants | 0.0 /100 | #304 | Tragic 63.5% |
| Osage | 0.0 /100 | #305 | Tragic 63.5% |