Immigrants from Japan vs Immigrants from Bolivia In Labor Force | Age 20-64
COMPARE
Immigrants from Japan
Immigrants from Bolivia
In Labor Force | Age 20-64
In Labor Force | Age 20-64 Comparison
Immigrants from Japan
Immigrants from Bolivia
80.1%
IN LABOR FORCE | AGE 20-64
97.3/ 100
METRIC RATING
82nd/ 347
METRIC RANK
81.9%
IN LABOR FORCE | AGE 20-64
100.0/ 100
METRIC RATING
3rd/ 347
METRIC RANK
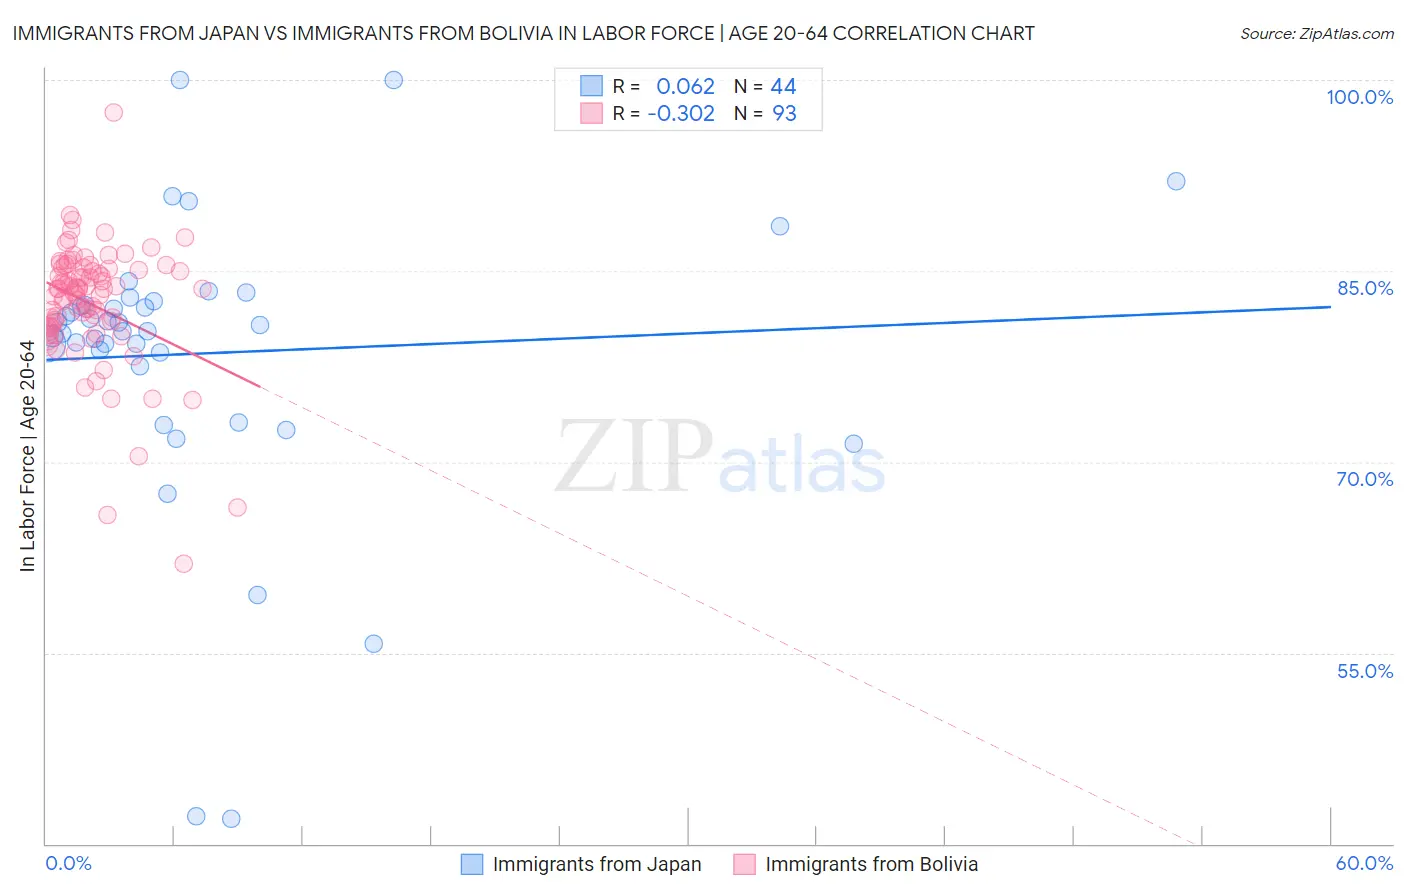
Immigrants from Japan vs Immigrants from Bolivia In Labor Force | Age 20-64 Correlation Chart
The statistical analysis conducted on geographies consisting of 340,160,154 people shows a slight positive correlation between the proportion of Immigrants from Japan and labor force participation rate among population between the ages 20 and 64 in the United States with a correlation coefficient (R) of 0.062 and weighted average of 80.1%. Similarly, the statistical analysis conducted on geographies consisting of 158,729,353 people shows a mild negative correlation between the proportion of Immigrants from Bolivia and labor force participation rate among population between the ages 20 and 64 in the United States with a correlation coefficient (R) of -0.302 and weighted average of 81.9%, a difference of 2.3%.
In Labor Force | Age 20-64 Correlation Summary
| Measurement | Immigrants from Japan | Immigrants from Bolivia |
| Minimum | 42.0% | 62.0% |
| Maximum | 100.0% | 97.4% |
| Range | 58.0% | 35.4% |
| Mean | 78.5% | 82.4% |
| Median | 80.5% | 83.6% |
| Interquartile 25% (IQ1) | 78.1% | 80.6% |
| Interquartile 75% (IQ3) | 82.5% | 85.2% |
| Interquartile Range (IQR) | 4.4% | 4.6% |
| Standard Deviation (Sample) | 11.4% | 4.9% |
| Standard Deviation (Population) | 11.3% | 4.9% |
Similar Demographics by In Labor Force | Age 20-64
Demographics Similar to Immigrants from Japan by In Labor Force | Age 20-64
In terms of in labor force | age 20-64, the demographic groups most similar to Immigrants from Japan are German Russian (80.1%, a difference of 0.0%), Colombian (80.1%, a difference of 0.0%), Immigrants from Latvia (80.1%, a difference of 0.010%), Jordanian (80.1%, a difference of 0.010%), and Immigrants from Egypt (80.1%, a difference of 0.010%).
| Demographics | Rating | Rank | In Labor Force | Age 20-64 |
| Immigrants | Afghanistan | 97.9 /100 | #75 | Exceptional 80.2% |
| Egyptians | 97.8 /100 | #76 | Exceptional 80.2% |
| Immigrants | Colombia | 97.8 /100 | #77 | Exceptional 80.2% |
| Immigrants | Romania | 97.8 /100 | #78 | Exceptional 80.2% |
| Asians | 97.7 /100 | #79 | Exceptional 80.2% |
| Immigrants | Croatia | 97.6 /100 | #80 | Exceptional 80.1% |
| German Russians | 97.3 /100 | #81 | Exceptional 80.1% |
| Immigrants | Japan | 97.3 /100 | #82 | Exceptional 80.1% |
| Colombians | 97.3 /100 | #83 | Exceptional 80.1% |
| Immigrants | Latvia | 97.2 /100 | #84 | Exceptional 80.1% |
| Jordanians | 97.2 /100 | #85 | Exceptional 80.1% |
| Immigrants | Egypt | 97.1 /100 | #86 | Exceptional 80.1% |
| Croatians | 97.1 /100 | #87 | Exceptional 80.1% |
| Chileans | 97.0 /100 | #88 | Exceptional 80.1% |
| Immigrants | Venezuela | 96.8 /100 | #89 | Exceptional 80.1% |
Demographics Similar to Immigrants from Bolivia by In Labor Force | Age 20-64
In terms of in labor force | age 20-64, the demographic groups most similar to Immigrants from Bolivia are Ethiopian (82.0%, a difference of 0.020%), Luxembourger (81.9%, a difference of 0.12%), Immigrants from Ethiopia (82.1%, a difference of 0.13%), Bolivian (81.7%, a difference of 0.32%), and Somali (81.6%, a difference of 0.42%).
| Demographics | Rating | Rank | In Labor Force | Age 20-64 |
| Immigrants | Ethiopia | 100.0 /100 | #1 | Exceptional 82.1% |
| Ethiopians | 100.0 /100 | #2 | Exceptional 82.0% |
| Immigrants | Bolivia | 100.0 /100 | #3 | Exceptional 81.9% |
| Luxembourgers | 100.0 /100 | #4 | Exceptional 81.9% |
| Bolivians | 100.0 /100 | #5 | Exceptional 81.7% |
| Somalis | 100.0 /100 | #6 | Exceptional 81.6% |
| Immigrants | Cameroon | 100.0 /100 | #7 | Exceptional 81.6% |
| Immigrants | Somalia | 100.0 /100 | #8 | Exceptional 81.6% |
| Sierra Leoneans | 100.0 /100 | #9 | Exceptional 81.5% |
| Immigrants | Sierra Leone | 100.0 /100 | #10 | Exceptional 81.5% |
| Immigrants | Eastern Africa | 100.0 /100 | #11 | Exceptional 81.3% |
| Immigrants | Eritrea | 100.0 /100 | #12 | Exceptional 81.3% |
| Immigrants | India | 100.0 /100 | #13 | Exceptional 81.3% |
| Cambodians | 100.0 /100 | #14 | Exceptional 81.1% |
| Bulgarians | 100.0 /100 | #15 | Exceptional 81.1% |