Immigrants from Southern Europe vs Immigrants from Bolivia In Labor Force | Age 20-64
COMPARE
Immigrants from Southern Europe
Immigrants from Bolivia
In Labor Force | Age 20-64
In Labor Force | Age 20-64 Comparison
Immigrants from Southern Europe
Immigrants from Bolivia
79.8%
IN LABOR FORCE | AGE 20-64
78.9/ 100
METRIC RATING
146th/ 347
METRIC RANK
81.9%
IN LABOR FORCE | AGE 20-64
100.0/ 100
METRIC RATING
3rd/ 347
METRIC RANK
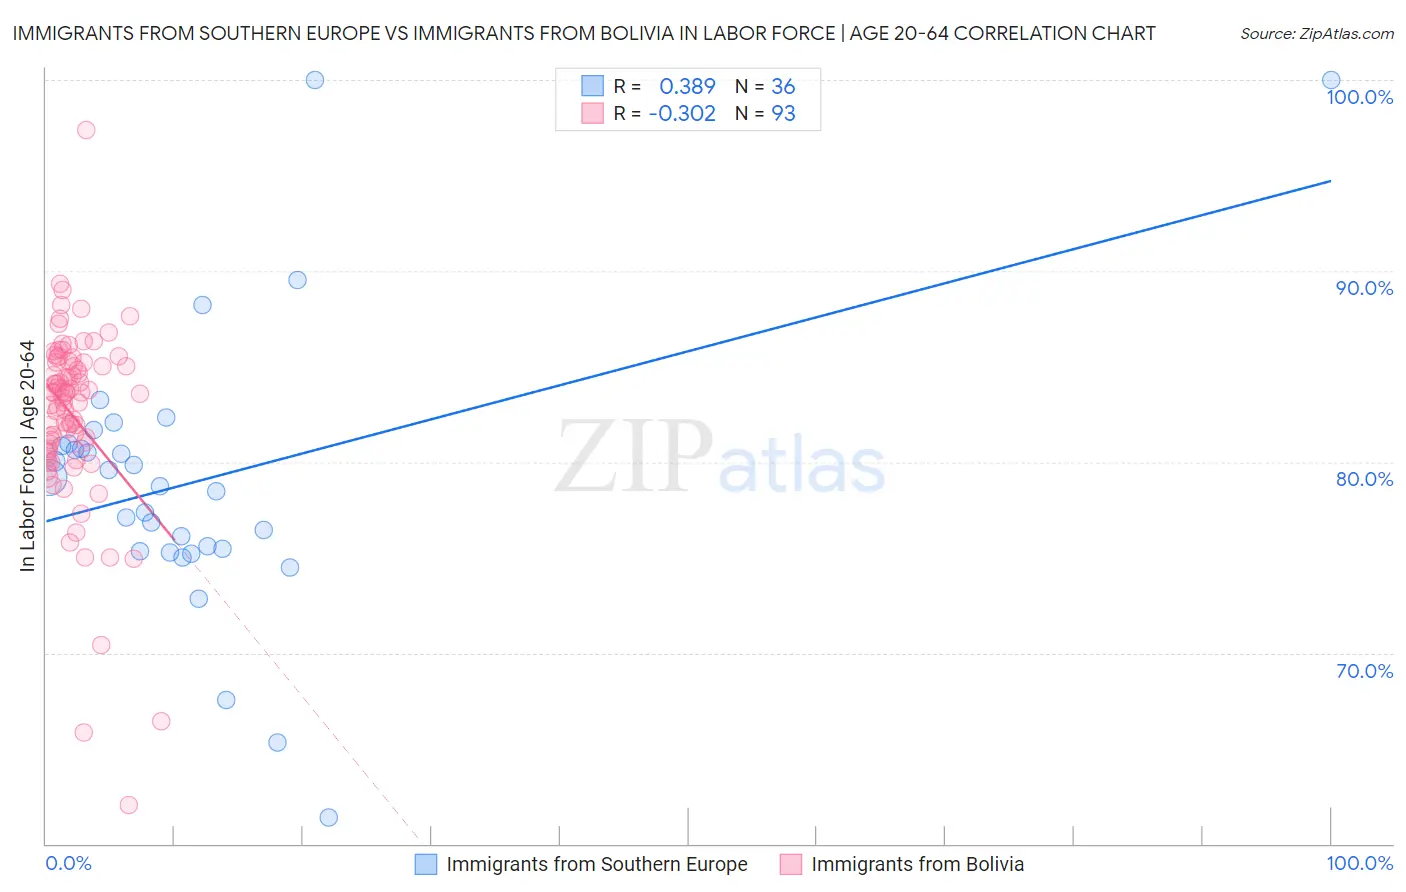
Immigrants from Southern Europe vs Immigrants from Bolivia In Labor Force | Age 20-64 Correlation Chart
The statistical analysis conducted on geographies consisting of 402,797,252 people shows a mild positive correlation between the proportion of Immigrants from Southern Europe and labor force participation rate among population between the ages 20 and 64 in the United States with a correlation coefficient (R) of 0.389 and weighted average of 79.8%. Similarly, the statistical analysis conducted on geographies consisting of 158,729,353 people shows a mild negative correlation between the proportion of Immigrants from Bolivia and labor force participation rate among population between the ages 20 and 64 in the United States with a correlation coefficient (R) of -0.302 and weighted average of 81.9%, a difference of 2.7%.
In Labor Force | Age 20-64 Correlation Summary
| Measurement | Immigrants from Southern Europe | Immigrants from Bolivia |
| Minimum | 61.4% | 62.0% |
| Maximum | 100.0% | 97.4% |
| Range | 38.6% | 35.4% |
| Mean | 79.0% | 82.4% |
| Median | 79.0% | 83.6% |
| Interquartile 25% (IQ1) | 75.4% | 80.6% |
| Interquartile 75% (IQ3) | 80.9% | 85.2% |
| Interquartile Range (IQR) | 5.5% | 4.6% |
| Standard Deviation (Sample) | 7.4% | 4.9% |
| Standard Deviation (Population) | 7.3% | 4.9% |
Similar Demographics by In Labor Force | Age 20-64
Demographics Similar to Immigrants from Southern Europe by In Labor Force | Age 20-64
In terms of in labor force | age 20-64, the demographic groups most similar to Immigrants from Southern Europe are Pakistani (79.8%, a difference of 0.0%), Immigrants from Israel (79.8%, a difference of 0.010%), Slovak (79.8%, a difference of 0.010%), Immigrants from Sweden (79.8%, a difference of 0.010%), and Korean (79.8%, a difference of 0.010%).
| Demographics | Rating | Rank | In Labor Force | Age 20-64 |
| Immigrants | Spain | 83.9 /100 | #139 | Excellent 79.8% |
| Immigrants | South Eastern Asia | 80.4 /100 | #140 | Excellent 79.8% |
| Immigrants | Israel | 80.0 /100 | #141 | Good 79.8% |
| Slovaks | 79.9 /100 | #142 | Good 79.8% |
| Immigrants | Sweden | 79.7 /100 | #143 | Good 79.8% |
| Koreans | 79.6 /100 | #144 | Good 79.8% |
| Pakistanis | 79.3 /100 | #145 | Good 79.8% |
| Immigrants | Southern Europe | 78.9 /100 | #146 | Good 79.8% |
| Immigrants | Philippines | 78.0 /100 | #147 | Good 79.8% |
| Romanians | 77.6 /100 | #148 | Good 79.8% |
| Icelanders | 75.1 /100 | #149 | Good 79.7% |
| Costa Ricans | 72.4 /100 | #150 | Good 79.7% |
| Scandinavians | 72.0 /100 | #151 | Good 79.7% |
| Immigrants | Northern Europe | 72.0 /100 | #152 | Good 79.7% |
| Immigrants | Kazakhstan | 69.5 /100 | #153 | Good 79.7% |
Demographics Similar to Immigrants from Bolivia by In Labor Force | Age 20-64
In terms of in labor force | age 20-64, the demographic groups most similar to Immigrants from Bolivia are Ethiopian (82.0%, a difference of 0.020%), Luxembourger (81.9%, a difference of 0.12%), Immigrants from Ethiopia (82.1%, a difference of 0.13%), Bolivian (81.7%, a difference of 0.32%), and Somali (81.6%, a difference of 0.42%).
| Demographics | Rating | Rank | In Labor Force | Age 20-64 |
| Immigrants | Ethiopia | 100.0 /100 | #1 | Exceptional 82.1% |
| Ethiopians | 100.0 /100 | #2 | Exceptional 82.0% |
| Immigrants | Bolivia | 100.0 /100 | #3 | Exceptional 81.9% |
| Luxembourgers | 100.0 /100 | #4 | Exceptional 81.9% |
| Bolivians | 100.0 /100 | #5 | Exceptional 81.7% |
| Somalis | 100.0 /100 | #6 | Exceptional 81.6% |
| Immigrants | Cameroon | 100.0 /100 | #7 | Exceptional 81.6% |
| Immigrants | Somalia | 100.0 /100 | #8 | Exceptional 81.6% |
| Sierra Leoneans | 100.0 /100 | #9 | Exceptional 81.5% |
| Immigrants | Sierra Leone | 100.0 /100 | #10 | Exceptional 81.5% |
| Immigrants | Eastern Africa | 100.0 /100 | #11 | Exceptional 81.3% |
| Immigrants | Eritrea | 100.0 /100 | #12 | Exceptional 81.3% |
| Immigrants | India | 100.0 /100 | #13 | Exceptional 81.3% |
| Cambodians | 100.0 /100 | #14 | Exceptional 81.1% |
| Bulgarians | 100.0 /100 | #15 | Exceptional 81.1% |