Immigrants from Nepal vs Immigrants from Bolivia In Labor Force | Age 20-64
COMPARE
Immigrants from Nepal
Immigrants from Bolivia
In Labor Force | Age 20-64
In Labor Force | Age 20-64 Comparison
Immigrants from Nepal
Immigrants from Bolivia
81.1%
IN LABOR FORCE | AGE 20-64
100.0/ 100
METRIC RATING
16th/ 347
METRIC RANK
81.9%
IN LABOR FORCE | AGE 20-64
100.0/ 100
METRIC RATING
3rd/ 347
METRIC RANK
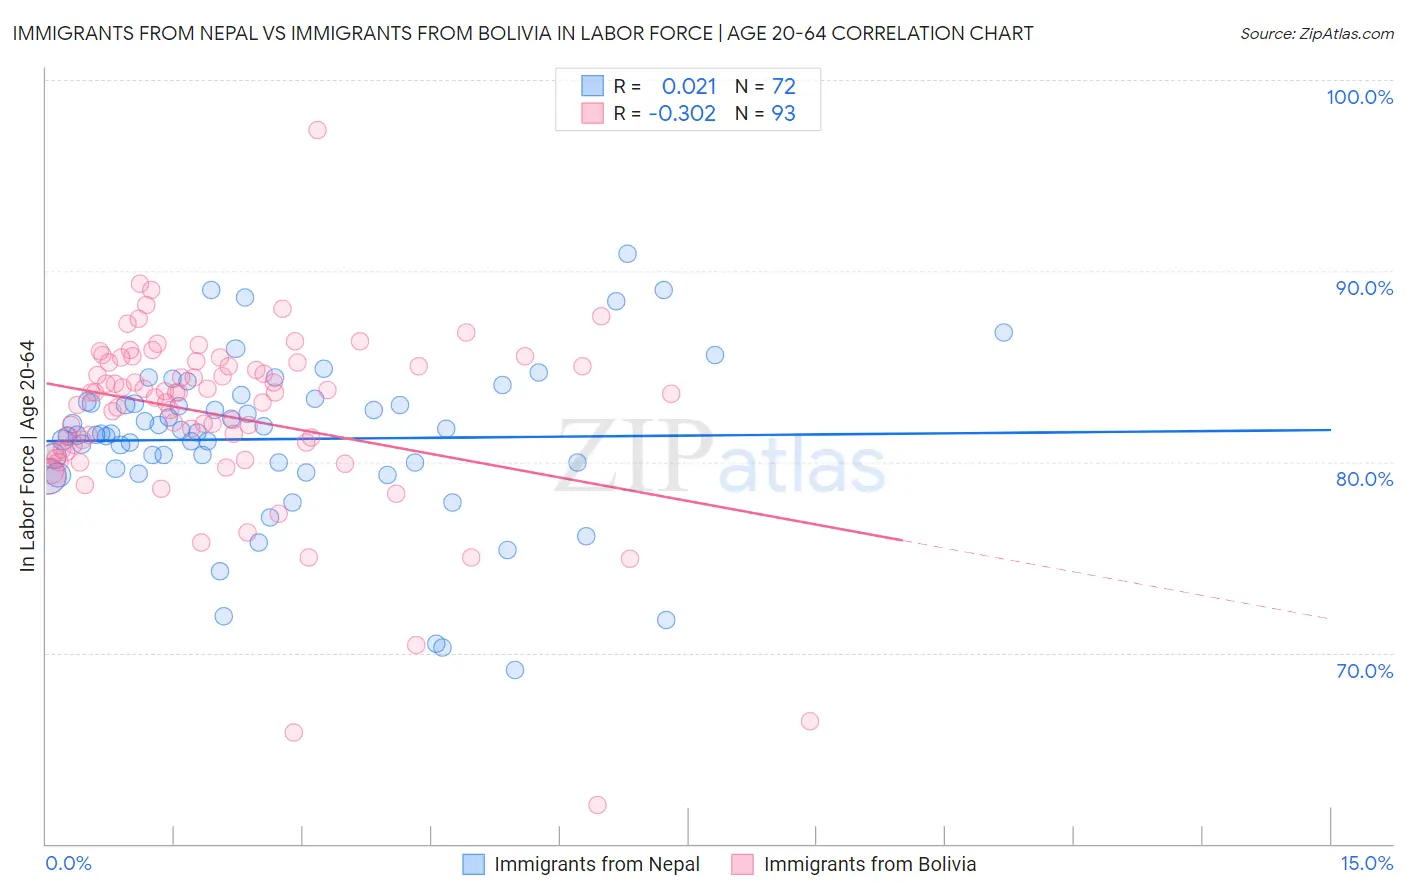
Immigrants from Nepal vs Immigrants from Bolivia In Labor Force | Age 20-64 Correlation Chart
The statistical analysis conducted on geographies consisting of 186,792,250 people shows no correlation between the proportion of Immigrants from Nepal and labor force participation rate among population between the ages 20 and 64 in the United States with a correlation coefficient (R) of 0.021 and weighted average of 81.1%. Similarly, the statistical analysis conducted on geographies consisting of 158,729,353 people shows a mild negative correlation between the proportion of Immigrants from Bolivia and labor force participation rate among population between the ages 20 and 64 in the United States with a correlation coefficient (R) of -0.302 and weighted average of 81.9%, a difference of 1.1%.
In Labor Force | Age 20-64 Correlation Summary
| Measurement | Immigrants from Nepal | Immigrants from Bolivia |
| Minimum | 69.1% | 62.0% |
| Maximum | 90.9% | 97.4% |
| Range | 21.8% | 35.4% |
| Mean | 81.2% | 82.4% |
| Median | 81.5% | 83.6% |
| Interquartile 25% (IQ1) | 79.8% | 80.6% |
| Interquartile 75% (IQ3) | 83.1% | 85.2% |
| Interquartile Range (IQR) | 3.3% | 4.6% |
| Standard Deviation (Sample) | 4.2% | 4.9% |
| Standard Deviation (Population) | 4.2% | 4.9% |
Demographics Similar to Immigrants from Nepal and Immigrants from Bolivia by In Labor Force | Age 20-64
In terms of in labor force | age 20-64, the demographic groups most similar to Immigrants from Nepal are Bulgarian (81.1%, a difference of 0.0%), Cambodian (81.1%, a difference of 0.020%), Norwegian (81.0%, a difference of 0.11%), Immigrants from Bulgaria (81.0%, a difference of 0.12%), and Zimbabwean (81.0%, a difference of 0.12%). Similarly, the demographic groups most similar to Immigrants from Bolivia are Ethiopian (82.0%, a difference of 0.020%), Luxembourger (81.9%, a difference of 0.12%), Immigrants from Ethiopia (82.1%, a difference of 0.13%), Bolivian (81.7%, a difference of 0.32%), and Somali (81.6%, a difference of 0.42%).
| Demographics | Rating | Rank | In Labor Force | Age 20-64 |
| Immigrants | Ethiopia | 100.0 /100 | #1 | Exceptional 82.1% |
| Ethiopians | 100.0 /100 | #2 | Exceptional 82.0% |
| Immigrants | Bolivia | 100.0 /100 | #3 | Exceptional 81.9% |
| Luxembourgers | 100.0 /100 | #4 | Exceptional 81.9% |
| Bolivians | 100.0 /100 | #5 | Exceptional 81.7% |
| Somalis | 100.0 /100 | #6 | Exceptional 81.6% |
| Immigrants | Cameroon | 100.0 /100 | #7 | Exceptional 81.6% |
| Immigrants | Somalia | 100.0 /100 | #8 | Exceptional 81.6% |
| Sierra Leoneans | 100.0 /100 | #9 | Exceptional 81.5% |
| Immigrants | Sierra Leone | 100.0 /100 | #10 | Exceptional 81.5% |
| Immigrants | Eastern Africa | 100.0 /100 | #11 | Exceptional 81.3% |
| Immigrants | Eritrea | 100.0 /100 | #12 | Exceptional 81.3% |
| Immigrants | India | 100.0 /100 | #13 | Exceptional 81.3% |
| Cambodians | 100.0 /100 | #14 | Exceptional 81.1% |
| Bulgarians | 100.0 /100 | #15 | Exceptional 81.1% |
| Immigrants | Nepal | 100.0 /100 | #16 | Exceptional 81.1% |
| Norwegians | 100.0 /100 | #17 | Exceptional 81.0% |
| Immigrants | Bulgaria | 100.0 /100 | #18 | Exceptional 81.0% |
| Zimbabweans | 100.0 /100 | #19 | Exceptional 81.0% |
| Thais | 100.0 /100 | #20 | Exceptional 80.9% |