Immigrants from Jamaica vs Austrian In Labor Force | Age 45-54
COMPARE
Immigrants from Jamaica
Austrian
In Labor Force | Age 45-54
In Labor Force | Age 45-54 Comparison
Immigrants from Jamaica
Austrians
82.1%
IN LABOR FORCE | AGE 45-54
2.7/ 100
METRIC RATING
224th/ 347
METRIC RANK
83.0%
IN LABOR FORCE | AGE 45-54
81.3/ 100
METRIC RATING
135th/ 347
METRIC RANK
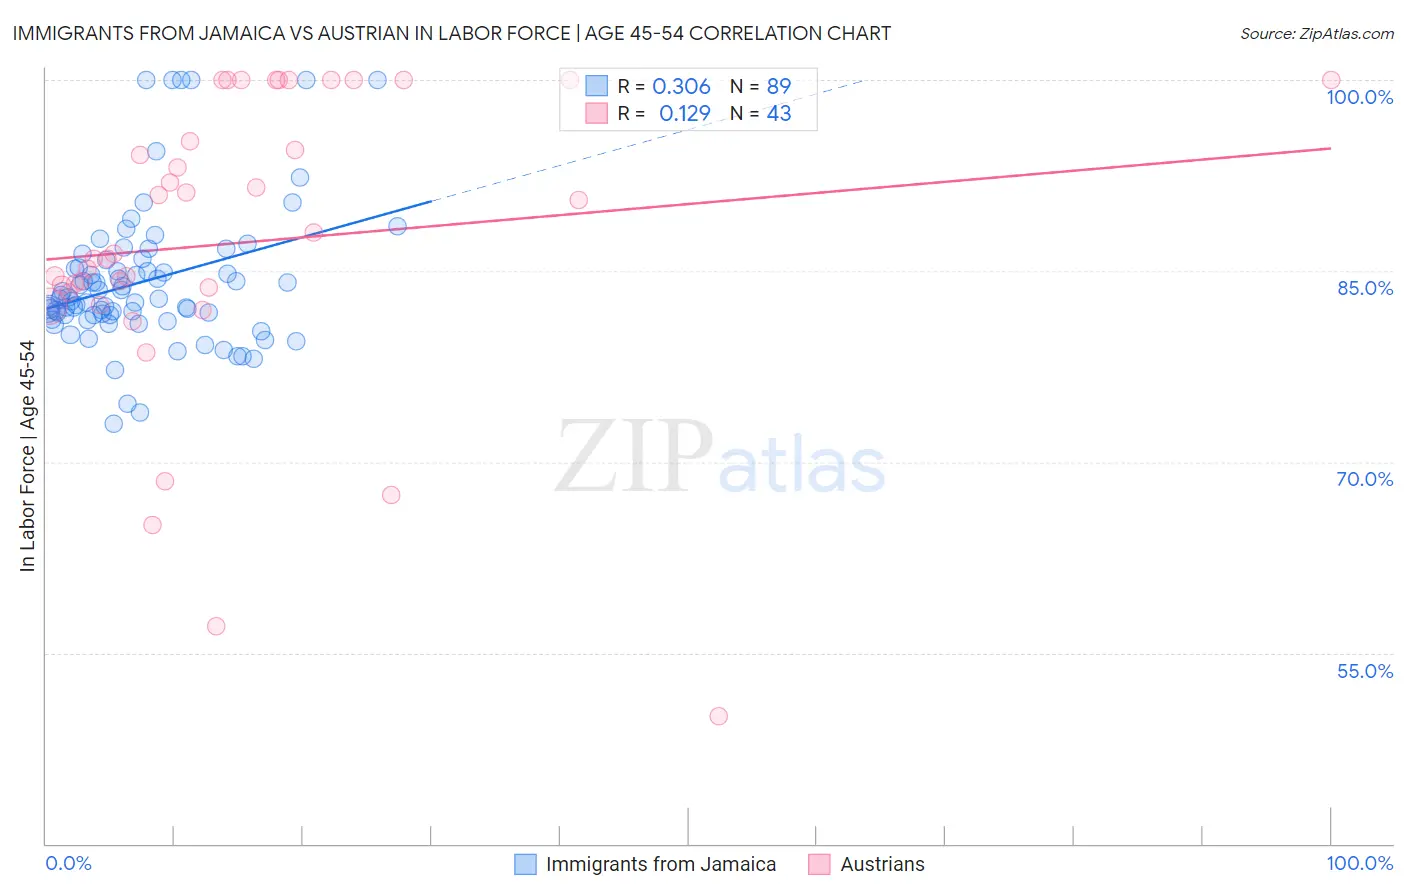
Immigrants from Jamaica vs Austrian In Labor Force | Age 45-54 Correlation Chart
The statistical analysis conducted on geographies consisting of 301,584,451 people shows a mild positive correlation between the proportion of Immigrants from Jamaica and labor force participation rate among population between the ages 45 and 54 in the United States with a correlation coefficient (R) of 0.306 and weighted average of 82.1%. Similarly, the statistical analysis conducted on geographies consisting of 451,779,620 people shows a poor positive correlation between the proportion of Austrians and labor force participation rate among population between the ages 45 and 54 in the United States with a correlation coefficient (R) of 0.129 and weighted average of 83.0%, a difference of 1.1%.
In Labor Force | Age 45-54 Correlation Summary
| Measurement | Immigrants from Jamaica | Austrian |
| Minimum | 73.0% | 50.0% |
| Maximum | 100.0% | 100.0% |
| Range | 27.0% | 50.0% |
| Mean | 84.2% | 87.2% |
| Median | 82.8% | 86.4% |
| Interquartile 25% (IQ1) | 81.5% | 83.3% |
| Interquartile 75% (IQ3) | 85.5% | 100.0% |
| Interquartile Range (IQR) | 4.0% | 16.7% |
| Standard Deviation (Sample) | 5.6% | 11.8% |
| Standard Deviation (Population) | 5.5% | 11.7% |
Similar Demographics by In Labor Force | Age 45-54
Demographics Similar to Immigrants from Jamaica by In Labor Force | Age 45-54
In terms of in labor force | age 45-54, the demographic groups most similar to Immigrants from Jamaica are Immigrants from Oceania (82.1%, a difference of 0.020%), Immigrants from Caribbean (82.1%, a difference of 0.020%), Immigrants (82.1%, a difference of 0.030%), Immigrants from Germany (82.1%, a difference of 0.030%), and Panamanian (82.2%, a difference of 0.060%).
| Demographics | Rating | Rank | In Labor Force | Age 45-54 |
| Portuguese | 4.7 /100 | #217 | Tragic 82.2% |
| English | 4.4 /100 | #218 | Tragic 82.2% |
| French | 4.1 /100 | #219 | Tragic 82.2% |
| Bahamians | 3.6 /100 | #220 | Tragic 82.2% |
| Panamanians | 3.5 /100 | #221 | Tragic 82.2% |
| Immigrants | Ecuador | 3.4 /100 | #222 | Tragic 82.2% |
| Immigrants | Immigrants | 3.1 /100 | #223 | Tragic 82.1% |
| Immigrants | Jamaica | 2.7 /100 | #224 | Tragic 82.1% |
| Immigrants | Oceania | 2.5 /100 | #225 | Tragic 82.1% |
| Immigrants | Caribbean | 2.5 /100 | #226 | Tragic 82.1% |
| Immigrants | Germany | 2.4 /100 | #227 | Tragic 82.1% |
| Cape Verdeans | 2.1 /100 | #228 | Tragic 82.1% |
| Immigrants | Burma/Myanmar | 1.9 /100 | #229 | Tragic 82.0% |
| Jamaicans | 1.8 /100 | #230 | Tragic 82.0% |
| Immigrants | Senegal | 1.7 /100 | #231 | Tragic 82.0% |
Demographics Similar to Austrians by In Labor Force | Age 45-54
In terms of in labor force | age 45-54, the demographic groups most similar to Austrians are Immigrants from Kazakhstan (83.0%, a difference of 0.0%), Sudanese (83.0%, a difference of 0.010%), Immigrants from Spain (83.0%, a difference of 0.010%), Liberian (83.0%, a difference of 0.020%), and Ghanaian (83.0%, a difference of 0.020%).
| Demographics | Rating | Rank | In Labor Force | Age 45-54 |
| Germans | 85.1 /100 | #128 | Excellent 83.1% |
| Immigrants | Northern Europe | 85.1 /100 | #129 | Excellent 83.1% |
| Immigrants | Israel | 84.7 /100 | #130 | Excellent 83.1% |
| Finns | 83.3 /100 | #131 | Excellent 83.1% |
| Immigrants | Ukraine | 82.9 /100 | #132 | Excellent 83.0% |
| Liberians | 82.7 /100 | #133 | Excellent 83.0% |
| Sudanese | 82.0 /100 | #134 | Excellent 83.0% |
| Austrians | 81.3 /100 | #135 | Excellent 83.0% |
| Immigrants | Kazakhstan | 81.0 /100 | #136 | Excellent 83.0% |
| Immigrants | Spain | 80.4 /100 | #137 | Excellent 83.0% |
| Ghanaians | 79.5 /100 | #138 | Good 83.0% |
| Scandinavians | 78.5 /100 | #139 | Good 83.0% |
| Yugoslavians | 78.3 /100 | #140 | Good 83.0% |
| Immigrants | Haiti | 77.9 /100 | #141 | Good 83.0% |
| Immigrants | Scotland | 77.8 /100 | #142 | Good 83.0% |