Immigrants from Jamaica vs Albanian In Labor Force | Age 25-29
COMPARE
Immigrants from Jamaica
Albanian
In Labor Force | Age 25-29
In Labor Force | Age 25-29 Comparison
Immigrants from Jamaica
Albanians
83.8%
IN LABOR FORCE | AGE 25-29
0.4/ 100
METRIC RATING
244th/ 347
METRIC RANK
85.5%
IN LABOR FORCE | AGE 25-29
99.7/ 100
METRIC RATING
54th/ 347
METRIC RANK
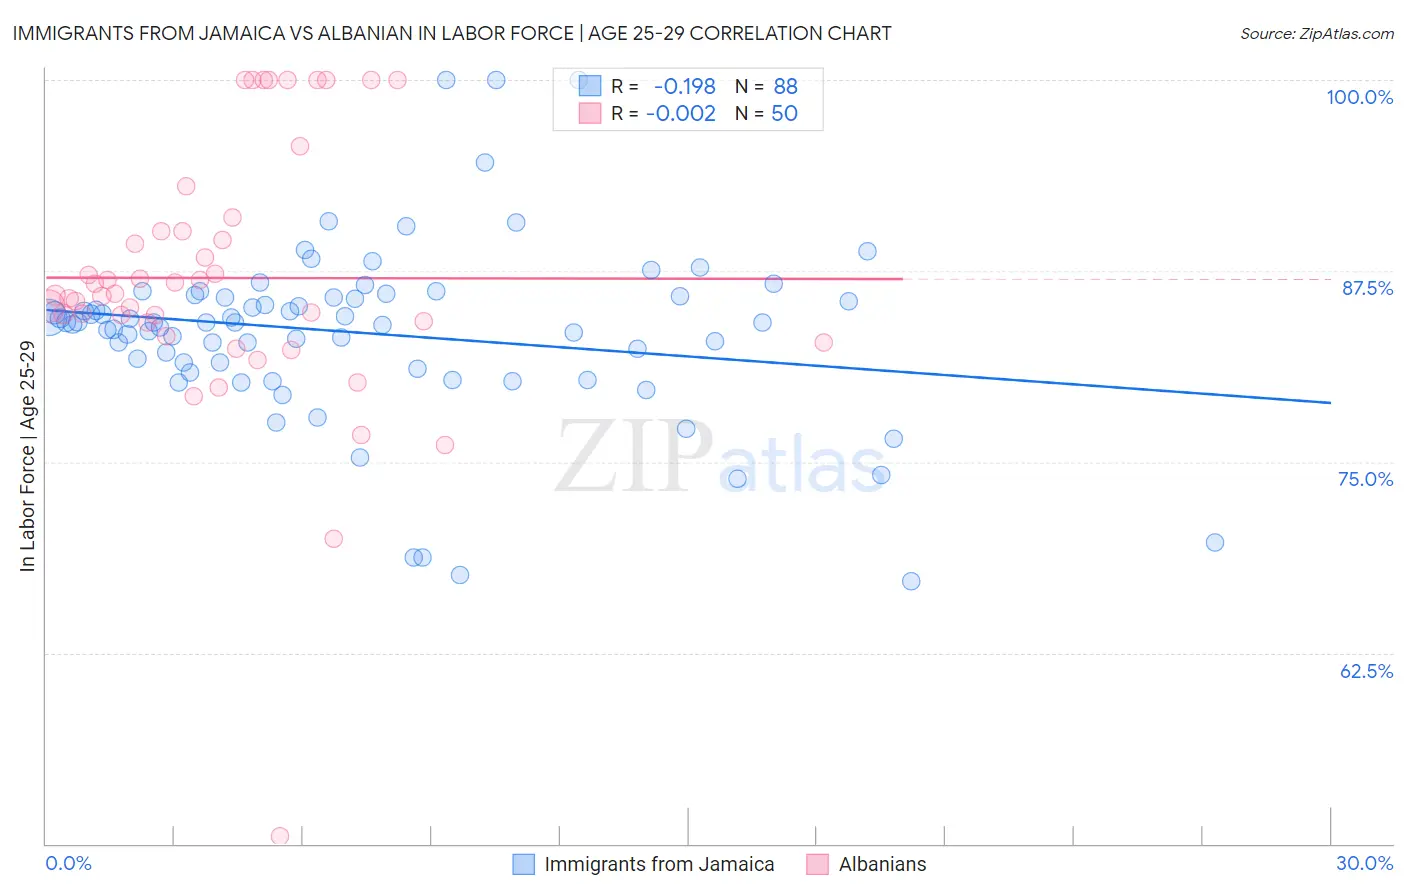
Immigrants from Jamaica vs Albanian In Labor Force | Age 25-29 Correlation Chart
The statistical analysis conducted on geographies consisting of 301,725,989 people shows a poor negative correlation between the proportion of Immigrants from Jamaica and labor force participation rate among population between the ages 25 and 29 in the United States with a correlation coefficient (R) of -0.198 and weighted average of 83.8%. Similarly, the statistical analysis conducted on geographies consisting of 193,233,766 people shows no correlation between the proportion of Albanians and labor force participation rate among population between the ages 25 and 29 in the United States with a correlation coefficient (R) of -0.002 and weighted average of 85.5%, a difference of 2.1%.
In Labor Force | Age 25-29 Correlation Summary
| Measurement | Immigrants from Jamaica | Albanian |
| Minimum | 67.2% | 50.5% |
| Maximum | 100.0% | 100.0% |
| Range | 32.8% | 49.5% |
| Mean | 83.4% | 87.0% |
| Median | 84.1% | 85.9% |
| Interquartile 25% (IQ1) | 81.3% | 84.2% |
| Interquartile 75% (IQ3) | 85.8% | 90.1% |
| Interquartile Range (IQR) | 4.5% | 5.9% |
| Standard Deviation (Sample) | 5.9% | 8.9% |
| Standard Deviation (Population) | 5.9% | 8.8% |
Similar Demographics by In Labor Force | Age 25-29
Demographics Similar to Immigrants from Jamaica by In Labor Force | Age 25-29
In terms of in labor force | age 25-29, the demographic groups most similar to Immigrants from Jamaica are Iroquois (83.8%, a difference of 0.0%), Salvadoran (83.8%, a difference of 0.040%), U.S. Virgin Islander (83.8%, a difference of 0.050%), Cree (83.8%, a difference of 0.050%), and Immigrants from El Salvador (83.7%, a difference of 0.070%).
| Demographics | Rating | Rank | In Labor Force | Age 25-29 |
| Immigrants | Immigrants | 0.9 /100 | #237 | Tragic 83.9% |
| Immigrants | Uzbekistan | 0.8 /100 | #238 | Tragic 83.9% |
| Jamaicans | 0.8 /100 | #239 | Tragic 83.9% |
| Trinidadians and Tobagonians | 0.7 /100 | #240 | Tragic 83.9% |
| Alsatians | 0.7 /100 | #241 | Tragic 83.9% |
| U.S. Virgin Islanders | 0.6 /100 | #242 | Tragic 83.8% |
| Salvadorans | 0.5 /100 | #243 | Tragic 83.8% |
| Immigrants | Jamaica | 0.4 /100 | #244 | Tragic 83.8% |
| Iroquois | 0.4 /100 | #245 | Tragic 83.8% |
| Cree | 0.3 /100 | #246 | Tragic 83.8% |
| Immigrants | El Salvador | 0.3 /100 | #247 | Tragic 83.7% |
| Immigrants | Nonimmigrants | 0.3 /100 | #248 | Tragic 83.7% |
| Hmong | 0.3 /100 | #249 | Tragic 83.7% |
| Central Americans | 0.2 /100 | #250 | Tragic 83.7% |
| Bahamians | 0.2 /100 | #251 | Tragic 83.7% |
Demographics Similar to Albanians by In Labor Force | Age 25-29
In terms of in labor force | age 25-29, the demographic groups most similar to Albanians are Belgian (85.5%, a difference of 0.0%), Immigrants from Brazil (85.5%, a difference of 0.010%), Immigrants from Poland (85.6%, a difference of 0.030%), Eastern European (85.5%, a difference of 0.040%), and Yugoslavian (85.6%, a difference of 0.050%).
| Demographics | Rating | Rank | In Labor Force | Age 25-29 |
| Turks | 99.8 /100 | #47 | Exceptional 85.6% |
| Italians | 99.8 /100 | #48 | Exceptional 85.6% |
| Swedes | 99.8 /100 | #49 | Exceptional 85.6% |
| Yugoslavians | 99.8 /100 | #50 | Exceptional 85.6% |
| Immigrants | Latvia | 99.8 /100 | #51 | Exceptional 85.6% |
| Immigrants | Poland | 99.7 /100 | #52 | Exceptional 85.6% |
| Belgians | 99.7 /100 | #53 | Exceptional 85.5% |
| Albanians | 99.7 /100 | #54 | Exceptional 85.5% |
| Immigrants | Brazil | 99.7 /100 | #55 | Exceptional 85.5% |
| Eastern Europeans | 99.6 /100 | #56 | Exceptional 85.5% |
| Estonians | 99.6 /100 | #57 | Exceptional 85.5% |
| Greeks | 99.6 /100 | #58 | Exceptional 85.5% |
| Immigrants | Morocco | 99.5 /100 | #59 | Exceptional 85.5% |
| Thais | 99.5 /100 | #60 | Exceptional 85.5% |
| Serbians | 99.5 /100 | #61 | Exceptional 85.5% |