Immigrants from Jamaica vs Carpatho Rusyn In Labor Force | Age 25-29
COMPARE
Immigrants from Jamaica
Carpatho Rusyn
In Labor Force | Age 25-29
In Labor Force | Age 25-29 Comparison
Immigrants from Jamaica
Carpatho Rusyns
83.8%
IN LABOR FORCE | AGE 25-29
0.4/ 100
METRIC RATING
244th/ 347
METRIC RANK
87.0%
IN LABOR FORCE | AGE 25-29
100.0/ 100
METRIC RATING
4th/ 347
METRIC RANK
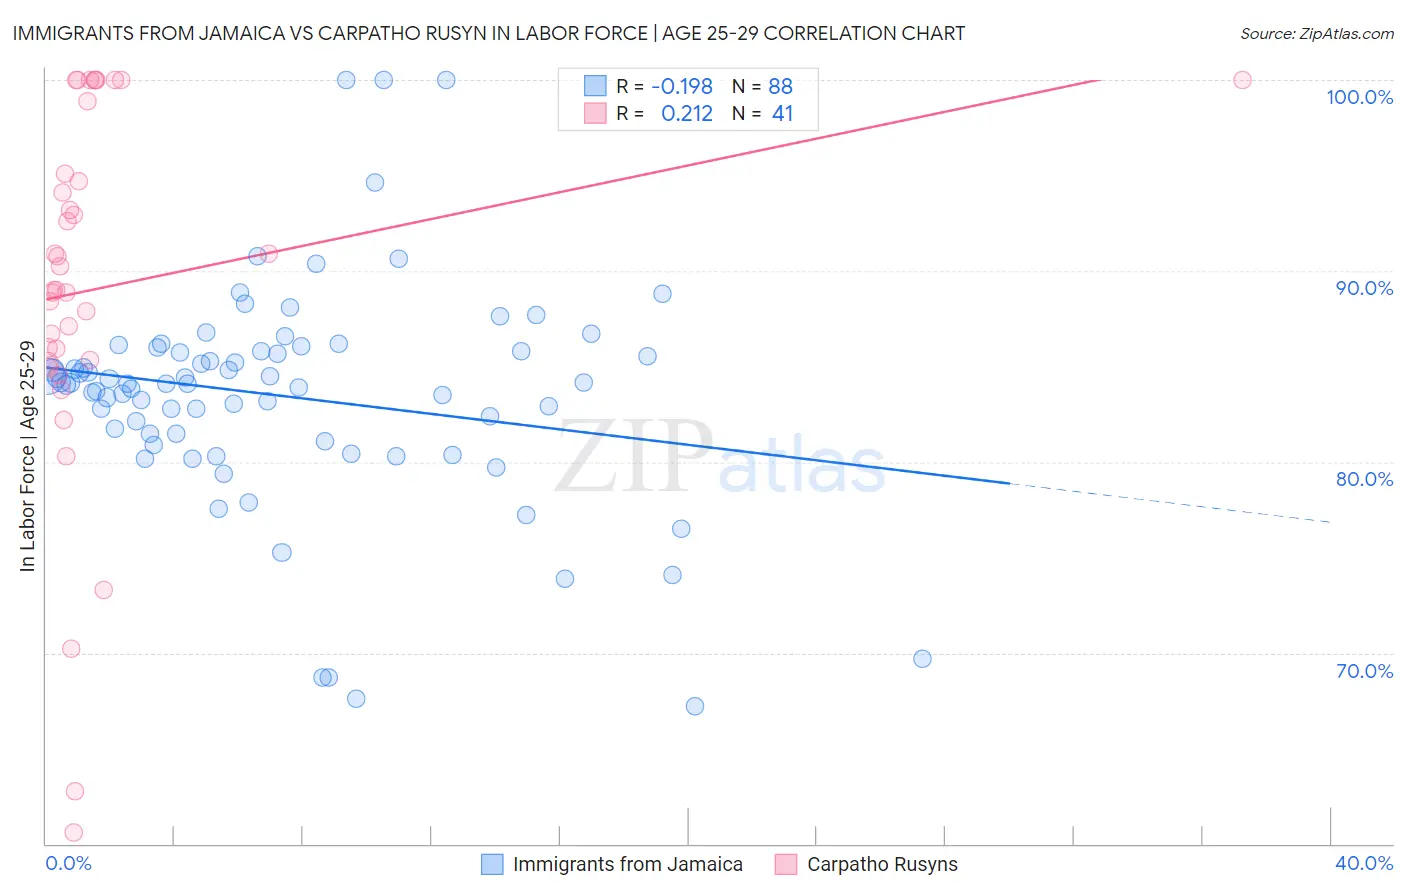
Immigrants from Jamaica vs Carpatho Rusyn In Labor Force | Age 25-29 Correlation Chart
The statistical analysis conducted on geographies consisting of 301,725,989 people shows a poor negative correlation between the proportion of Immigrants from Jamaica and labor force participation rate among population between the ages 25 and 29 in the United States with a correlation coefficient (R) of -0.198 and weighted average of 83.8%. Similarly, the statistical analysis conducted on geographies consisting of 58,870,912 people shows a weak positive correlation between the proportion of Carpatho Rusyns and labor force participation rate among population between the ages 25 and 29 in the United States with a correlation coefficient (R) of 0.212 and weighted average of 87.0%, a difference of 3.8%.
In Labor Force | Age 25-29 Correlation Summary
| Measurement | Immigrants from Jamaica | Carpatho Rusyn |
| Minimum | 67.2% | 60.6% |
| Maximum | 100.0% | 100.0% |
| Range | 32.8% | 39.4% |
| Mean | 83.4% | 89.1% |
| Median | 84.1% | 89.0% |
| Interquartile 25% (IQ1) | 81.3% | 85.2% |
| Interquartile 75% (IQ3) | 85.8% | 97.0% |
| Interquartile Range (IQR) | 4.5% | 11.8% |
| Standard Deviation (Sample) | 5.9% | 9.6% |
| Standard Deviation (Population) | 5.9% | 9.5% |
Similar Demographics by In Labor Force | Age 25-29
Demographics Similar to Immigrants from Jamaica by In Labor Force | Age 25-29
In terms of in labor force | age 25-29, the demographic groups most similar to Immigrants from Jamaica are Iroquois (83.8%, a difference of 0.0%), Salvadoran (83.8%, a difference of 0.040%), U.S. Virgin Islander (83.8%, a difference of 0.050%), Cree (83.8%, a difference of 0.050%), and Immigrants from El Salvador (83.7%, a difference of 0.070%).
| Demographics | Rating | Rank | In Labor Force | Age 25-29 |
| Immigrants | Immigrants | 0.9 /100 | #237 | Tragic 83.9% |
| Immigrants | Uzbekistan | 0.8 /100 | #238 | Tragic 83.9% |
| Jamaicans | 0.8 /100 | #239 | Tragic 83.9% |
| Trinidadians and Tobagonians | 0.7 /100 | #240 | Tragic 83.9% |
| Alsatians | 0.7 /100 | #241 | Tragic 83.9% |
| U.S. Virgin Islanders | 0.6 /100 | #242 | Tragic 83.8% |
| Salvadorans | 0.5 /100 | #243 | Tragic 83.8% |
| Immigrants | Jamaica | 0.4 /100 | #244 | Tragic 83.8% |
| Iroquois | 0.4 /100 | #245 | Tragic 83.8% |
| Cree | 0.3 /100 | #246 | Tragic 83.8% |
| Immigrants | El Salvador | 0.3 /100 | #247 | Tragic 83.7% |
| Immigrants | Nonimmigrants | 0.3 /100 | #248 | Tragic 83.7% |
| Hmong | 0.3 /100 | #249 | Tragic 83.7% |
| Central Americans | 0.2 /100 | #250 | Tragic 83.7% |
| Bahamians | 0.2 /100 | #251 | Tragic 83.7% |
Demographics Similar to Carpatho Rusyns by In Labor Force | Age 25-29
In terms of in labor force | age 25-29, the demographic groups most similar to Carpatho Rusyns are Immigrants from Somalia (87.1%, a difference of 0.090%), Somali (87.1%, a difference of 0.090%), Luxembourger (86.9%, a difference of 0.10%), Slovene (86.4%, a difference of 0.72%), and Immigrants from Bosnia and Herzegovina (86.3%, a difference of 0.84%).
| Demographics | Rating | Rank | In Labor Force | Age 25-29 |
| Tsimshian | 100.0 /100 | #1 | Exceptional 88.7% |
| Immigrants | Somalia | 100.0 /100 | #2 | Exceptional 87.1% |
| Somalis | 100.0 /100 | #3 | Exceptional 87.1% |
| Carpatho Rusyns | 100.0 /100 | #4 | Exceptional 87.0% |
| Luxembourgers | 100.0 /100 | #5 | Exceptional 86.9% |
| Slovenes | 100.0 /100 | #6 | Exceptional 86.4% |
| Immigrants | Bosnia and Herzegovina | 100.0 /100 | #7 | Exceptional 86.3% |
| Immigrants | Cabo Verde | 100.0 /100 | #8 | Exceptional 86.2% |
| Ethiopians | 100.0 /100 | #9 | Exceptional 86.2% |
| Liberians | 100.0 /100 | #10 | Exceptional 86.1% |
| Immigrants | Ethiopia | 100.0 /100 | #11 | Exceptional 86.1% |
| Immigrants | Lithuania | 100.0 /100 | #12 | Exceptional 86.1% |
| Norwegians | 100.0 /100 | #13 | Exceptional 86.1% |
| Latvians | 100.0 /100 | #14 | Exceptional 86.1% |
| Bolivians | 100.0 /100 | #15 | Exceptional 86.1% |