Egyptian vs Welsh In Labor Force | Age 30-34

COMPARE

Egyptian
Race
Ancestry
AfghanAfricanAlaska NativeAlaskan AthabascanAlbanianAleutAlsatianAmericanApacheArabArapahoArgentineanArmenianAssyrian/Chaldean/SyriacAustralianAustrianBahamianBangladeshiBarbadianBasqueBelgianBelizeanBermudanBhutaneseBlackfeetBolivianBrazilianBritishBritish West IndianBulgarianBurmeseCajunCambodianCanadianCape VerdeanCarpatho RusynCelticCentral AmericanCentral American IndianCherokeeCheyenneChickasawChileanChineseChippewaChoctawColombianColvilleComancheCosta RicanCreeCreekCroatianCrowCubanCypriotCzechCzechoslovakianDanishDelawareDominicanDutchDutch West IndianEastern EuropeanEcuadorianEgyptianEnglishEstonianEthiopianEuropeanFijianFilipinoFinnishFrenchFrench American IndianFrench CanadianGermanGerman RussianGhanaianGreekGuamanian/ChamorroGuatemalanGuyaneseHaitianHmongHonduranHopiHoumaHungarianIcelanderIndian (Asian)IndonesianInupiatIranianIraqiIrishIroquoisIsraeliItalianJamaicanJapaneseJordanianKenyanKiowaKoreanLaotianLatvianLebaneseLiberianLithuanianLumbeeLuxembourgerMacedonianMalaysianMalteseMarshalleseMenomineeMexicanMexican American IndianMongolianMoroccanNative HawaiianNavajoNepaleseNew ZealanderNicaraguanNigerianNorthern EuropeanNorwegianOkinawanOsageOttawaPaiutePakistaniPalestinianPanamanianParaguayanPennsylvania GermanPeruvianPimaPolishPortuguesePotawatomiPuebloPuerto RicanPuget Sound SalishRomanianRussianSalvadoranSamoanScandinavianScotch-IrishScottishSeminoleSenegaleseSerbianShoshoneSierra LeoneanSiouxSlavicSlovakSloveneSomaliSouth AfricanSouth AmericanSouth American IndianSoviet UnionSpaniardSpanishSpanish AmericanSpanish American IndianSri LankanSubsaharan AfricanSudaneseSwedishSwissSyrianTaiwaneseThaiTlingit-HaidaTohono O'OdhamTonganTrinidadian and TobagonianTsimshianTurkishU.S. Virgin IslanderUgandanUkrainianUruguayanUteVenezuelanVietnameseWest IndianYakamaYaquiYugoslavianYumanYup'ikZimbabwean
Immigration
NonimmigrantsImmigrantsAfghanistanAfricaAlbaniaArgentinaArmeniaAsiaAustraliaAustriaBahamasBangladeshBarbadosBelarusBelgiumBelizeBoliviaBosnia and HerzegovinaBrazilBulgariaBurma/MyanmarCabo VerdeCambodiaCameroonCanadaCaribbeanCentral AmericaChileChinaColombiaCongoCosta RicaCroatiaCubaCzechoslovakiaDenmarkDominicaDominican RepublicEastern AfricaEastern AsiaEastern EuropeEcuadorEgyptEl SalvadorEnglandEritreaEthiopiaEuropeFijiFranceGermanyGhanaGreeceGrenadaGuatemalaGuyanaHaitiHondurasHong KongHungaryIndiaIndonesiaIranIraqIrelandIsraelItalyJamaicaJapanJordanKazakhstanKenyaKoreaKuwaitLaosLatin AmericaLatviaLebanonLiberiaLithuaniaMalaysiaMexicoMicronesiaMiddle AfricaMoldovaMoroccoNepalNetherlandsNicaraguaNigeriaNorth AmericaNorth MacedoniaNorthern AfricaNorthern EuropeNorwayOceaniaPakistanPanamaPeruPhilippinesPolandPortugalRomaniaRussiaSaudi ArabiaScotlandSenegalSerbiaSierra LeoneSingaporeSomaliaSouth AfricaSouth AmericaSouth Central AsiaSouth Eastern AsiaSouthern EuropeSpainSri LankaSt. Vincent and the GrenadinesSudanSwedenSwitzerlandSyriaTaiwanThailandTrinidad and TobagoTurkeyUgandaUkraineUruguayUzbekistanVenezuelaVietnamWest IndiesWestern AfricaWestern AsiaWestern EuropeYemenZaireZimbabweAzores
Welsh
Race
Ancestry
AfghanAfricanAlaska NativeAlaskan AthabascanAlbanianAleutAlsatianAmericanApacheArabArapahoArgentineanArmenianAssyrian/Chaldean/SyriacAustralianAustrianBahamianBangladeshiBarbadianBasqueBelgianBelizeanBermudanBhutaneseBlackfeetBolivianBrazilianBritishBritish West IndianBulgarianBurmeseCajunCambodianCanadianCape VerdeanCarpatho RusynCelticCentral AmericanCentral American IndianCherokeeCheyenneChickasawChileanChineseChippewaChoctawColombianColvilleComancheCosta RicanCreeCreekCroatianCrowCubanCypriotCzechCzechoslovakianDanishDelawareDominicanDutchDutch West IndianEastern EuropeanEcuadorianEnglishEstonianEthiopianEuropeanFijianFilipinoFinnishFrenchFrench American IndianFrench CanadianGermanGerman RussianGhanaianGreekGuamanian/ChamorroGuatemalanGuyaneseHaitianHmongHonduranHopiHoumaHungarianIcelanderIndian (Asian)IndonesianInupiatIranianIraqiIrishIroquoisIsraeliItalianJamaicanJapaneseJordanianKenyanKiowaKoreanLaotianLatvianLebaneseLiberianLithuanianLumbeeLuxembourgerMacedonianMalaysianMalteseMarshalleseMenomineeMexicanMexican American IndianMongolianMoroccanNative HawaiianNavajoNepaleseNew ZealanderNicaraguanNigerianNorthern EuropeanNorwegianOkinawanOsageOttawaPaiutePakistaniPalestinianPanamanianParaguayanPennsylvania GermanPeruvianPimaPolishPortuguesePotawatomiPuebloPuerto RicanPuget Sound SalishRomanianRussianSalvadoranSamoanScandinavianScotch-IrishScottishSeminoleSenegaleseSerbianShoshoneSierra LeoneanSiouxSlavicSlovakSloveneSomaliSouth AfricanSouth AmericanSouth American IndianSoviet UnionSpaniardSpanishSpanish AmericanSpanish American IndianSri LankanSubsaharan AfricanSudaneseSwedishSwissSyrianTaiwaneseThaiTlingit-HaidaTohono O'OdhamTonganTrinidadian and TobagonianTsimshianTurkishU.S. Virgin IslanderUgandanUkrainianUruguayanUteVenezuelanVietnameseWelshWest IndianYakamaYaquiYugoslavianYumanYup'ikZimbabwean
Immigration
NonimmigrantsImmigrantsAfghanistanAfricaAlbaniaArgentinaArmeniaAsiaAustraliaAustriaBahamasBangladeshBarbadosBelarusBelgiumBelizeBoliviaBosnia and HerzegovinaBrazilBulgariaBurma/MyanmarCabo VerdeCambodiaCameroonCanadaCaribbeanCentral AmericaChileChinaColombiaCongoCosta RicaCroatiaCubaCzechoslovakiaDenmarkDominicaDominican RepublicEastern AfricaEastern AsiaEastern EuropeEcuadorEgyptEl SalvadorEnglandEritreaEthiopiaEuropeFijiFranceGermanyGhanaGreeceGrenadaGuatemalaGuyanaHaitiHondurasHong KongHungaryIndiaIndonesiaIranIraqIrelandIsraelItalyJamaicaJapanJordanKazakhstanKenyaKoreaKuwaitLaosLatin AmericaLatviaLebanonLiberiaLithuaniaMalaysiaMexicoMicronesiaMiddle AfricaMoldovaMoroccoNepalNetherlandsNicaraguaNigeriaNorth AmericaNorth MacedoniaNorthern AfricaNorthern EuropeNorwayOceaniaPakistanPanamaPeruPhilippinesPolandPortugalRomaniaRussiaSaudi ArabiaScotlandSenegalSerbiaSierra LeoneSingaporeSomaliaSouth AfricaSouth AmericaSouth Central AsiaSouth Eastern AsiaSouthern EuropeSpainSri LankaSt. Vincent and the GrenadinesSudanSwedenSwitzerlandSyriaTaiwanThailandTrinidad and TobagoTurkeyUgandaUkraineUruguayUzbekistanVenezuelaVietnamWest IndiesWestern AfricaWestern AsiaWestern EuropeYemenZaireZimbabweAzores
In Labor Force | Age 30-34
Income
Poverty
Unemployment
Labor Participation
Family Structure
Vehicle Availability
Education Level
Disability

In Labor Force | Age 30-34 Comparison

Egyptians

Welsh

Exceptional
Tragic
85.1%
IN LABOR FORCE | AGE 30-34
94.5/ 100
METRIC RATING
116th/ 347
METRIC RANK
84.2%
IN LABOR FORCE | AGE 30-34
2.7/ 100
METRIC RATING
229th/ 347
METRIC RANK

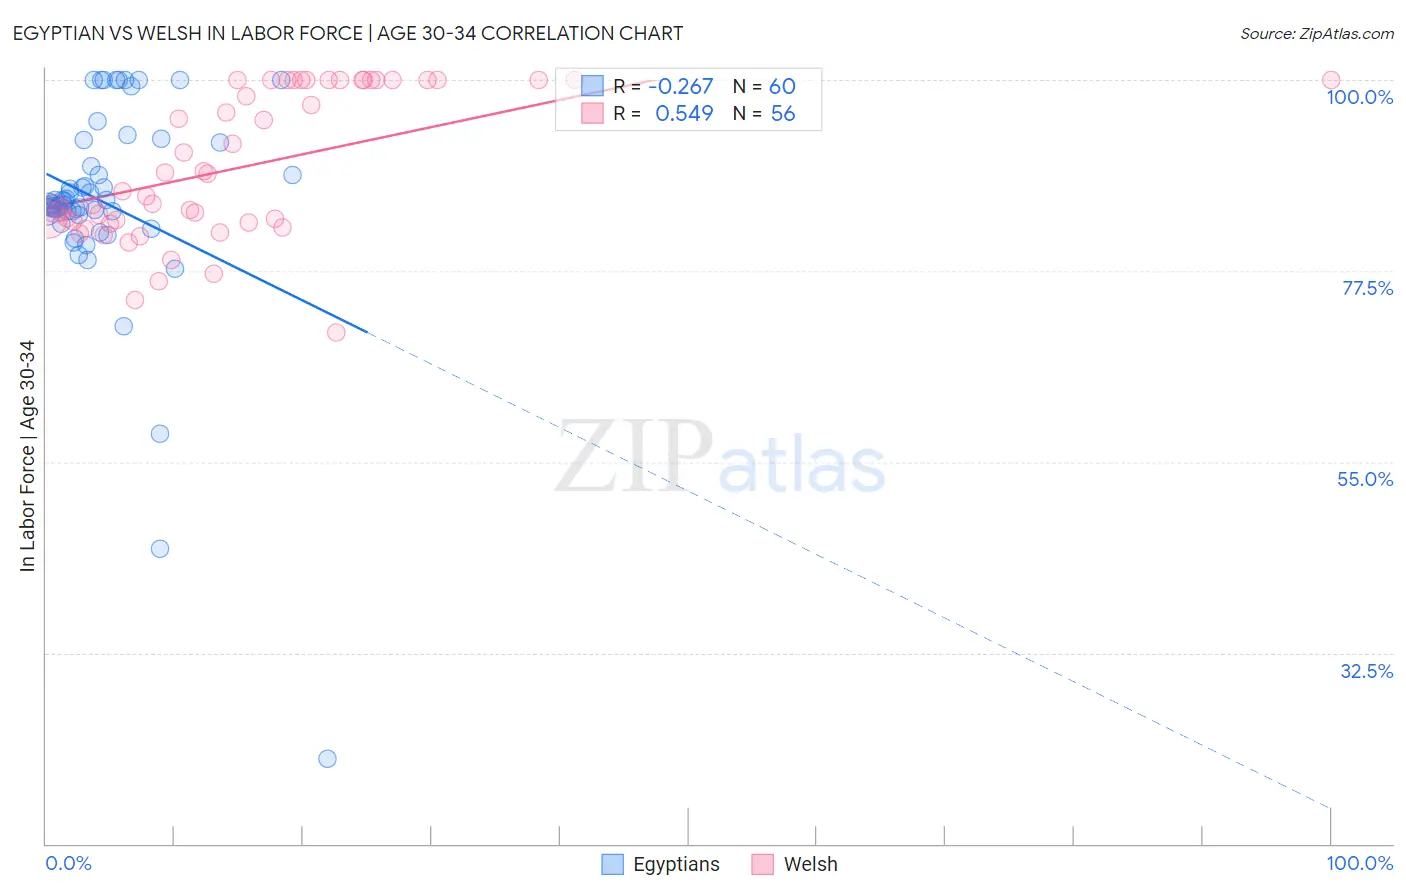
Egyptian vs Welsh In Labor Force | Age 30-34 Correlation Chart

The statistical analysis conducted on geographies consisting of 276,796,346 people shows a weak negative correlation between the proportion of Egyptians and labor force participation rate among population between the ages 30 and 34 in the United States with a correlation coefficient (R) of -0.267 and weighted average of 85.1%. Similarly, the statistical analysis conducted on geographies consisting of 527,874,569 people shows a substantial positive correlation between the proportion of Welsh and labor force participation rate among population between the ages 30 and 34 in the United States with a correlation coefficient (R) of 0.549 and weighted average of 84.2%, a difference of 1.1%.
Egyptian vs Welsh In Labor Force | Age 30-34

In Labor Force | Age 30-34 Correlation Summary

MeasurementEgyptianWelsh
Minimum20.0%70.3%
Maximum100.0%100.0%
Range80.0%29.7%
Mean85.5%89.9%
Median85.4%87.9%
Interquartile 25% (IQ1)84.3%83.3%
Interquartile 75% (IQ3)91.3%100.0%
Interquartile Range (IQR)7.0%16.7%
Standard Deviation (Sample)12.8%8.7%
Standard Deviation (Population)12.7%8.6%

Similar Demographics by In Labor Force | Age 30-34

Demographics Similar to Egyptians by In Labor Force | Age 30-34

In terms of in labor force | age 30-34, the demographic groups most similar to Egyptians are Immigrants from South Central Asia (85.1%, a difference of 0.0%), Immigrants from Scotland (85.1%, a difference of 0.010%), Immigrants from Hungary (85.1%, a difference of 0.010%), Immigrants from Romania (85.1%, a difference of 0.010%), and Yugoslavian (85.1%, a difference of 0.010%).
DemographicsRating | RankIn Labor Force | Age 30-34
Argentineans
95.8
/100
|
#109
Exceptional
85.1%
Immigrants | South Africa
95.3
/100
|
#110
Exceptional
85.1%
Immigrants | Scotland
94.9
/100
|
#111
Exceptional
85.1%
Immigrants | Hungary
94.8
/100
|
#112
Exceptional
85.1%
Immigrants | Romania
94.7
/100
|
#113
Exceptional
85.1%
Yugoslavians
94.7
/100
|
#114
Exceptional
85.1%
Immigrants | South Central Asia
94.6
/100
|
#115
Exceptional
85.1%
Egyptians
94.5
/100
|
#116
Exceptional
85.1%
Immigrants | Denmark
94.3
/100
|
#117
Exceptional
85.1%
Immigrants | Malaysia
94.2
/100
|
#118
Exceptional
85.1%
Asians
93.4
/100
|
#119
Exceptional
85.1%
Immigrants | Southern Europe
93.3
/100
|
#120
Exceptional
85.1%
Immigrants | Egypt
93.2
/100
|
#121
Exceptional
85.1%
Immigrants | Kuwait
92.6
/100
|
#122
Exceptional
85.1%
Armenians
92.2
/100
|
#123
Exceptional
85.0%

Demographics Similar to Welsh by In Labor Force | Age 30-34

In terms of in labor force | age 30-34, the demographic groups most similar to Welsh are Immigrants from Cuba (84.2%, a difference of 0.010%), Immigrants from Haiti (84.2%, a difference of 0.010%), Immigrants from Bahamas (84.1%, a difference of 0.010%), Scottish (84.2%, a difference of 0.020%), and Immigrants from El Salvador (84.2%, a difference of 0.020%).
DemographicsRating | RankIn Labor Force | Age 30-34
Panamanians
3.8
/100
|
#222
Tragic
84.2%
Immigrants | Laos
3.6
/100
|
#223
Tragic
84.2%
Cubans
3.4
/100
|
#224
Tragic
84.2%
Scottish
3.1
/100
|
#225
Tragic
84.2%
Immigrants | El Salvador
3.0
/100
|
#226
Tragic
84.2%
Immigrants | Cuba
3.0
/100
|
#227
Tragic
84.2%
Immigrants | Haiti
2.8
/100
|
#228
Tragic
84.2%
Welsh
2.7
/100
|
#229
Tragic
84.2%
Immigrants | Bahamas
2.6
/100
|
#230
Tragic
84.1%
Malaysians
2.2
/100
|
#231
Tragic
84.1%
Immigrants | Immigrants
2.0
/100
|
#232
Tragic
84.1%
West Indians
1.9
/100
|
#233
Tragic
84.1%
Haitians
1.8
/100
|
#234
Tragic
84.1%
French American Indians
1.7
/100
|
#235
Tragic
84.1%
U.S. Virgin Islanders
1.5
/100
|
#236
Tragic
84.1%