Immigrants from Iraq vs Mexican American Indian In Labor Force | Age 20-64
COMPARE
Immigrants from Iraq
Mexican American Indian
In Labor Force | Age 20-64
In Labor Force | Age 20-64 Comparison
Immigrants from Iraq
Mexican American Indians
79.6%
IN LABOR FORCE | AGE 20-64
62.0/ 100
METRIC RATING
167th/ 347
METRIC RANK
78.2%
IN LABOR FORCE | AGE 20-64
0.0/ 100
METRIC RATING
278th/ 347
METRIC RANK
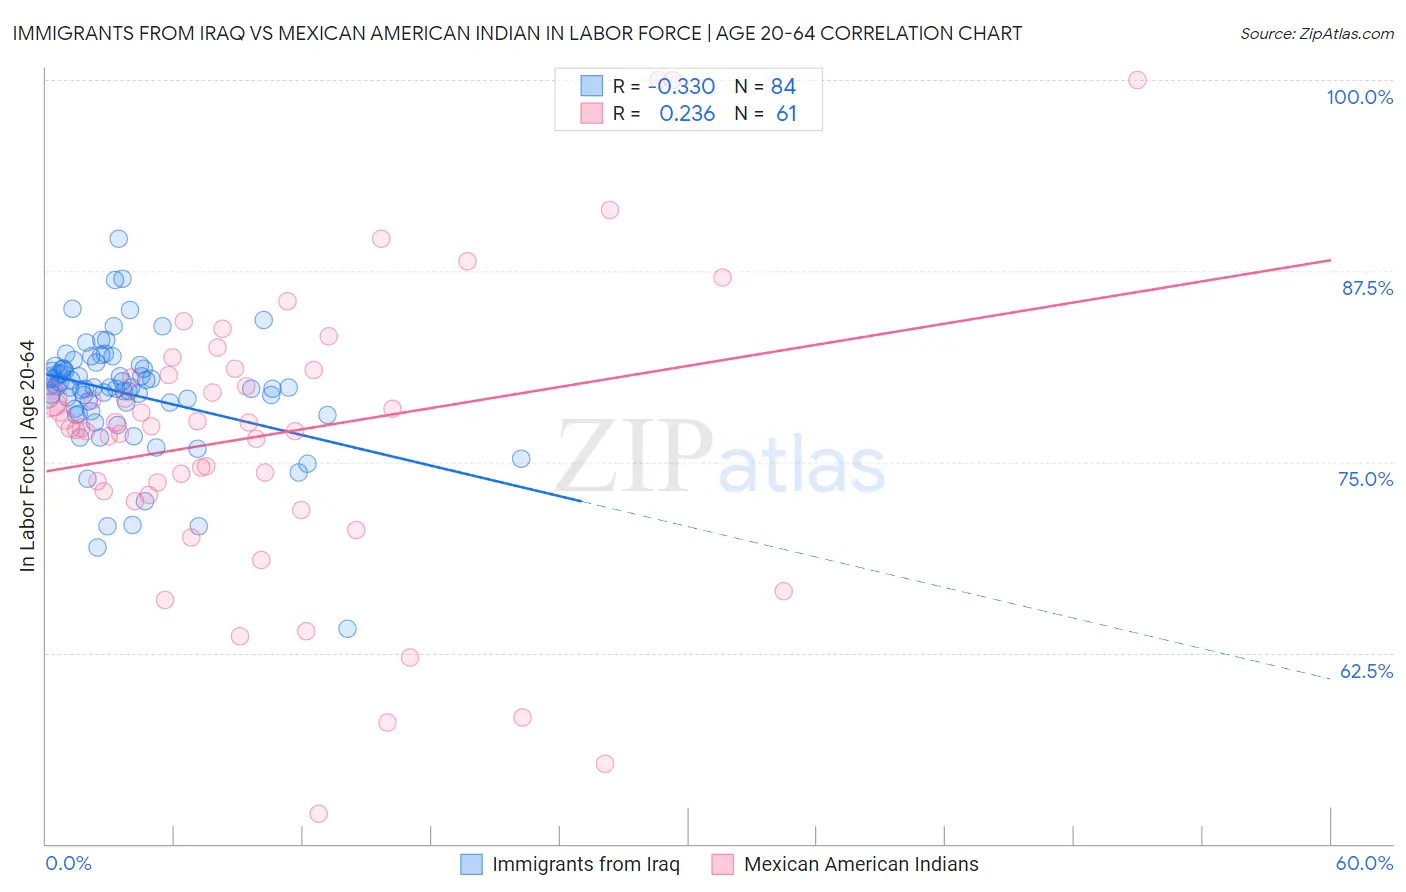
Immigrants from Iraq vs Mexican American Indian In Labor Force | Age 20-64 Correlation Chart
The statistical analysis conducted on geographies consisting of 194,730,293 people shows a mild negative correlation between the proportion of Immigrants from Iraq and labor force participation rate among population between the ages 20 and 64 in the United States with a correlation coefficient (R) of -0.330 and weighted average of 79.6%. Similarly, the statistical analysis conducted on geographies consisting of 317,601,754 people shows a weak positive correlation between the proportion of Mexican American Indians and labor force participation rate among population between the ages 20 and 64 in the United States with a correlation coefficient (R) of 0.236 and weighted average of 78.2%, a difference of 1.8%.
In Labor Force | Age 20-64 Correlation Summary
| Measurement | Immigrants from Iraq | Mexican American Indian |
| Minimum | 64.1% | 52.0% |
| Maximum | 89.6% | 100.0% |
| Range | 25.5% | 48.0% |
| Mean | 79.5% | 76.8% |
| Median | 79.9% | 77.3% |
| Interquartile 25% (IQ1) | 78.4% | 73.0% |
| Interquartile 75% (IQ3) | 81.1% | 80.9% |
| Interquartile Range (IQR) | 2.7% | 7.9% |
| Standard Deviation (Sample) | 3.8% | 9.5% |
| Standard Deviation (Population) | 3.8% | 9.4% |
Similar Demographics by In Labor Force | Age 20-64
Demographics Similar to Immigrants from Iraq by In Labor Force | Age 20-64
In terms of in labor force | age 20-64, the demographic groups most similar to Immigrants from Iraq are Immigrants from Indonesia (79.6%, a difference of 0.0%), Okinawan (79.6%, a difference of 0.010%), Immigrants from Costa Rica (79.7%, a difference of 0.020%), Immigrants from Burma/Myanmar (79.7%, a difference of 0.020%), and Nigerian (79.7%, a difference of 0.020%).
| Demographics | Rating | Rank | In Labor Force | Age 20-64 |
| Moroccans | 66.7 /100 | #160 | Good 79.7% |
| South Africans | 66.2 /100 | #161 | Good 79.7% |
| Germans | 65.2 /100 | #162 | Good 79.7% |
| Immigrants | Costa Rica | 64.6 /100 | #163 | Good 79.7% |
| Immigrants | Burma/Myanmar | 64.4 /100 | #164 | Good 79.7% |
| Nigerians | 64.0 /100 | #165 | Good 79.7% |
| Okinawans | 62.7 /100 | #166 | Good 79.6% |
| Immigrants | Iraq | 62.0 /100 | #167 | Good 79.6% |
| Immigrants | Indonesia | 61.8 /100 | #168 | Good 79.6% |
| Laotians | 58.4 /100 | #169 | Average 79.6% |
| Slavs | 54.0 /100 | #170 | Average 79.6% |
| Immigrants | Switzerland | 53.3 /100 | #171 | Average 79.6% |
| Immigrants | Belgium | 53.1 /100 | #172 | Average 79.6% |
| Immigrants | Scotland | 52.4 /100 | #173 | Average 79.6% |
| Syrians | 50.0 /100 | #174 | Average 79.6% |
Demographics Similar to Mexican American Indians by In Labor Force | Age 20-64
In terms of in labor force | age 20-64, the demographic groups most similar to Mexican American Indians are Immigrants from Bahamas (78.2%, a difference of 0.0%), Spanish (78.2%, a difference of 0.020%), Puget Sound Salish (78.2%, a difference of 0.020%), Aleut (78.2%, a difference of 0.030%), and French American Indian (78.2%, a difference of 0.050%).
| Demographics | Rating | Rank | In Labor Force | Age 20-64 |
| Immigrants | Latin America | 0.0 /100 | #271 | Tragic 78.3% |
| Marshallese | 0.0 /100 | #272 | Tragic 78.3% |
| French American Indians | 0.0 /100 | #273 | Tragic 78.2% |
| Aleuts | 0.0 /100 | #274 | Tragic 78.2% |
| Spanish | 0.0 /100 | #275 | Tragic 78.2% |
| Puget Sound Salish | 0.0 /100 | #276 | Tragic 78.2% |
| Immigrants | Bahamas | 0.0 /100 | #277 | Tragic 78.2% |
| Mexican American Indians | 0.0 /100 | #278 | Tragic 78.2% |
| Belizeans | 0.0 /100 | #279 | Tragic 78.2% |
| Immigrants | Dominica | 0.0 /100 | #280 | Tragic 78.1% |
| Guyanese | 0.0 /100 | #281 | Tragic 78.1% |
| Immigrants | St. Vincent and the Grenadines | 0.0 /100 | #282 | Tragic 78.1% |
| Immigrants | Nonimmigrants | 0.0 /100 | #283 | Tragic 78.1% |
| Immigrants | Guyana | 0.0 /100 | #284 | Tragic 78.1% |
| Osage | 0.0 /100 | #285 | Tragic 78.0% |