Immigrants from Iraq vs Jordanian In Labor Force | Age 20-64
COMPARE
Immigrants from Iraq
Jordanian
In Labor Force | Age 20-64
In Labor Force | Age 20-64 Comparison
Immigrants from Iraq
Jordanians
79.6%
IN LABOR FORCE | AGE 20-64
62.0/ 100
METRIC RATING
167th/ 347
METRIC RANK
80.1%
IN LABOR FORCE | AGE 20-64
97.2/ 100
METRIC RATING
85th/ 347
METRIC RANK
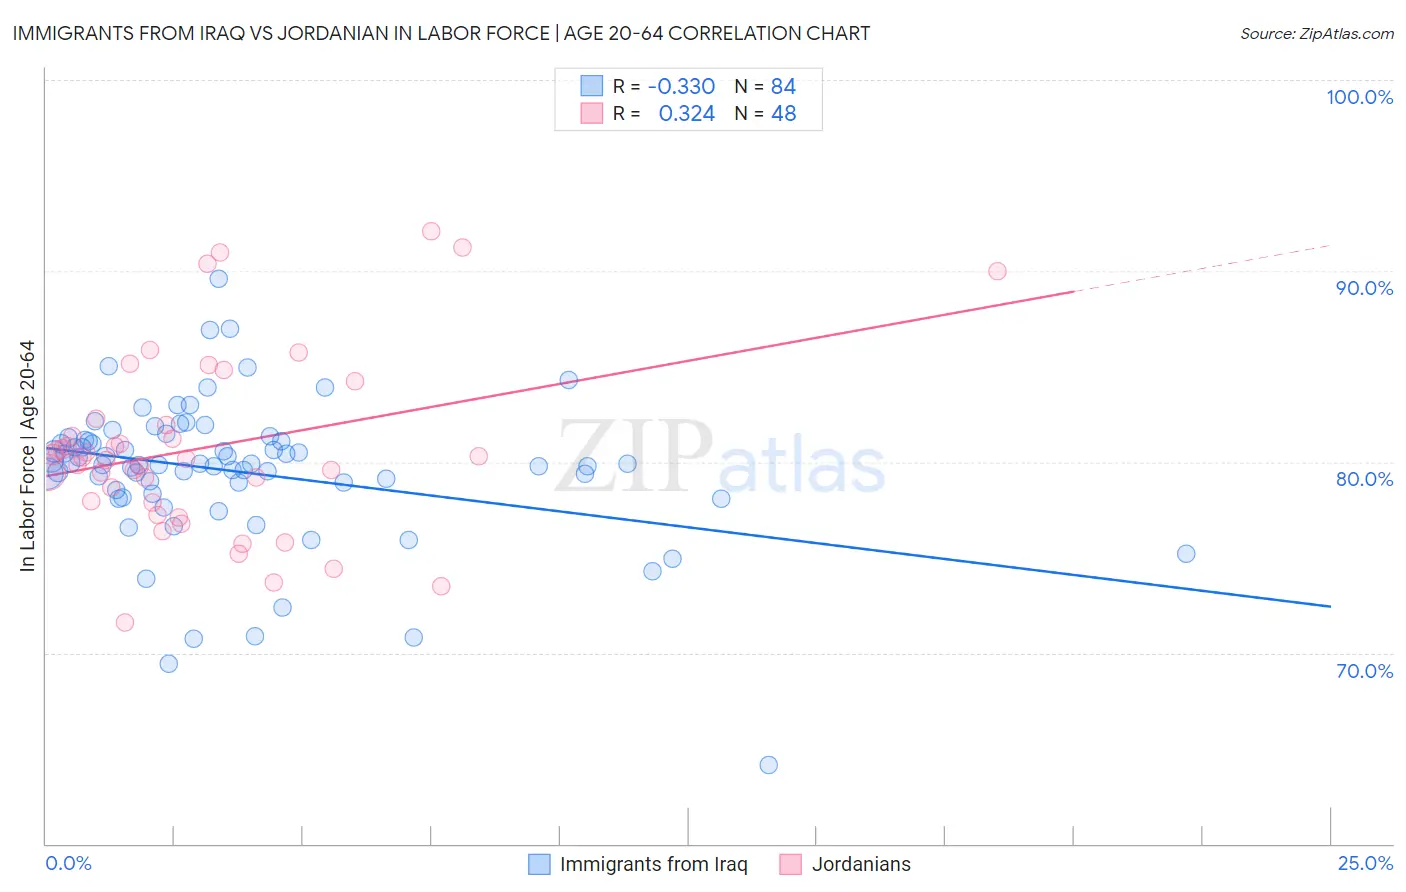
Immigrants from Iraq vs Jordanian In Labor Force | Age 20-64 Correlation Chart
The statistical analysis conducted on geographies consisting of 194,730,293 people shows a mild negative correlation between the proportion of Immigrants from Iraq and labor force participation rate among population between the ages 20 and 64 in the United States with a correlation coefficient (R) of -0.330 and weighted average of 79.6%. Similarly, the statistical analysis conducted on geographies consisting of 166,422,649 people shows a mild positive correlation between the proportion of Jordanians and labor force participation rate among population between the ages 20 and 64 in the United States with a correlation coefficient (R) of 0.324 and weighted average of 80.1%, a difference of 0.61%.
In Labor Force | Age 20-64 Correlation Summary
| Measurement | Immigrants from Iraq | Jordanian |
| Minimum | 64.1% | 71.6% |
| Maximum | 89.6% | 92.1% |
| Range | 25.5% | 20.5% |
| Mean | 79.5% | 80.7% |
| Median | 79.9% | 80.2% |
| Interquartile 25% (IQ1) | 78.4% | 77.9% |
| Interquartile 75% (IQ3) | 81.1% | 82.1% |
| Interquartile Range (IQR) | 2.7% | 4.2% |
| Standard Deviation (Sample) | 3.8% | 4.7% |
| Standard Deviation (Population) | 3.8% | 4.7% |
Similar Demographics by In Labor Force | Age 20-64
Demographics Similar to Immigrants from Iraq by In Labor Force | Age 20-64
In terms of in labor force | age 20-64, the demographic groups most similar to Immigrants from Iraq are Immigrants from Indonesia (79.6%, a difference of 0.0%), Okinawan (79.6%, a difference of 0.010%), Immigrants from Costa Rica (79.7%, a difference of 0.020%), Immigrants from Burma/Myanmar (79.7%, a difference of 0.020%), and Nigerian (79.7%, a difference of 0.020%).
| Demographics | Rating | Rank | In Labor Force | Age 20-64 |
| Moroccans | 66.7 /100 | #160 | Good 79.7% |
| South Africans | 66.2 /100 | #161 | Good 79.7% |
| Germans | 65.2 /100 | #162 | Good 79.7% |
| Immigrants | Costa Rica | 64.6 /100 | #163 | Good 79.7% |
| Immigrants | Burma/Myanmar | 64.4 /100 | #164 | Good 79.7% |
| Nigerians | 64.0 /100 | #165 | Good 79.7% |
| Okinawans | 62.7 /100 | #166 | Good 79.6% |
| Immigrants | Iraq | 62.0 /100 | #167 | Good 79.6% |
| Immigrants | Indonesia | 61.8 /100 | #168 | Good 79.6% |
| Laotians | 58.4 /100 | #169 | Average 79.6% |
| Slavs | 54.0 /100 | #170 | Average 79.6% |
| Immigrants | Switzerland | 53.3 /100 | #171 | Average 79.6% |
| Immigrants | Belgium | 53.1 /100 | #172 | Average 79.6% |
| Immigrants | Scotland | 52.4 /100 | #173 | Average 79.6% |
| Syrians | 50.0 /100 | #174 | Average 79.6% |
Demographics Similar to Jordanians by In Labor Force | Age 20-64
In terms of in labor force | age 20-64, the demographic groups most similar to Jordanians are Immigrants from Egypt (80.1%, a difference of 0.0%), Croatian (80.1%, a difference of 0.0%), German Russian (80.1%, a difference of 0.010%), Immigrants from Japan (80.1%, a difference of 0.010%), and Colombian (80.1%, a difference of 0.010%).
| Demographics | Rating | Rank | In Labor Force | Age 20-64 |
| Immigrants | Romania | 97.8 /100 | #78 | Exceptional 80.2% |
| Asians | 97.7 /100 | #79 | Exceptional 80.2% |
| Immigrants | Croatia | 97.6 /100 | #80 | Exceptional 80.1% |
| German Russians | 97.3 /100 | #81 | Exceptional 80.1% |
| Immigrants | Japan | 97.3 /100 | #82 | Exceptional 80.1% |
| Colombians | 97.3 /100 | #83 | Exceptional 80.1% |
| Immigrants | Latvia | 97.2 /100 | #84 | Exceptional 80.1% |
| Jordanians | 97.2 /100 | #85 | Exceptional 80.1% |
| Immigrants | Egypt | 97.1 /100 | #86 | Exceptional 80.1% |
| Croatians | 97.1 /100 | #87 | Exceptional 80.1% |
| Chileans | 97.0 /100 | #88 | Exceptional 80.1% |
| Immigrants | Venezuela | 96.8 /100 | #89 | Exceptional 80.1% |
| Poles | 96.8 /100 | #90 | Exceptional 80.1% |
| Uruguayans | 96.7 /100 | #91 | Exceptional 80.1% |
| Ghanaians | 96.7 /100 | #92 | Exceptional 80.1% |